Dow theory is a very integral part of technical analysis. Before the advent of candlesticks, the Dow theory was widely used in Western countries. In fact the concepts of Dow Theory are still being used today. Good traders work by combining the best of candlesticks and the Dow theory.
The Dow Theory was introduced to the world by Charles H. Dow, who also founded the Dow-Jones Financial News Service (Wall Street Journal). He wrote a series of articles from the early 1900s, which in later years became known as ‘The Dow Theory’. The credit for assembling these articles goes to William P. Hamilton, who over a period of 27 years compiled these articles with the necessary examples. Since the time has changed a lot since the time of Charles Dow, there are also believers of Dow theory and there are critics of it.
The Dow Theory Principles
The Dow Theory is built on certain assumptions. These are called the principles of the Dow Theory. These were developed by Charles H. Dow by studying the markets for many years in a row. There are 9 guiding principles behind the Dow Theory:
| No. | Principals | Description |
|---|---|---|
| 1 | The market index discounts everything | The stock market index discounts all news that is public or hidden. If a sudden event happens, the index rises or falls accordingly and reaches the correct price. |
| 2 | There are three types of trends in the market | Primary Trend, Secondary Trend and Minor Trend |
| 3 | Primary Trend | The primary trend is the main trend of the market which lasts from one year to several years. It indicates the long and broad direction of the market. Long-term investors tend to look at the primary trends only, whereas an active trader is interested in all types of trends. The primary trend can be either uptrend or a downtrend. |
| 4 | Secondary Trend | These are the corrections coming in the primary trend. You can see these as minor blockages created in the long term trend of the market. For example- correction in bull market, correction or rally in bear market. This secondary trend, which is opposite to the primary trend, can last for a few weeks or sometimes even a few months. |
| 5 | Minor / Daily Trend | These are daily ups and downs in the market. Some traders call this market noise. |
| 6 | Must be verified by all indexes | We cannot confirm a trend on the basis of just one index. For example, the market is considered bullish only when all the indices like CNX Nifty, CNX Nifty Midcap, CNX Nifty Smallcap etc all move in an upward direction simultaneously. It will not be possible to determine the bullish trend in the markets with the help of CNXNifty only |
| 7 | should also be confirmed by volume | The trend should be confirmed by price as well as volume. If the market is going up and it is a trend then the volume should increase with the price rise in the market. And with the price going down the volume should also come down. In a down trending market the volume should increase with the price fall and the volume should decrease when the price goes up. The volume is explained in detail in Chapter 12. |
| 8 | Sideways market can be seen as a secondary trend | Markets can trade sideways for a long period of time. For example, between 2010 and 2013, the stock of Reliance Industries was in the range of 860 to 990. Sideways market can be seen instead of secondary trend |
| 9 | closing price is most important | Out of the open, high, low and close, the close is the most important because it tells the final price of the stock. |
The different phases of the market

According to the Dow theory, there are three different phases in the market which keep coming back again and again, these are called accumulation, mark up and distribution phase.
The accumulation phase is usually followed by a steep drop. A huge downturn in the market leaves many players disappointed and they don’t think the market will go up now. Prices hit their all-time lows and yet no one in the market wants to buy the shares because they think there may be more selling. Because of this, the share price remains at its low level, so smart money enters the market.
Smart money is usually called the money that big institutional investors i.e. big companies bring. They want to invest for long term. Such investors usually enter the market when they see value for themselves in the price of the shares, that is, the price of the shares has fallen significantly. In such a situation, these institutional investors go on buying shares in large quantities continuously for a long time, due to their act of accumulating shares, it is called accumulation phase. That is why it is easy to find buyers in the accumulation phase and that is why the price of the shares does not fall much further in this phase. This means that the market has reached its lowest price. In such a situation, the market prepares its support level. This phase can last for several months.
When the big institutional investors i.e. smart money buy all the shares available in the market once, then the short term trader starts seeing support in the market. This is why it is called mark up phase. In this phase, the price of the shares goes upwards very fast, this phase is the biggest identity of this phase. are unable to find. After this, all the new investors and the analysts and everyone starts seeing the bullish and high levels in these stocks.
Finally, when the stock price reaches its 52-week high or all-time high, everyone starts talking about the stock market, the news is published in the newspapers, the market environment improves. And everywhere there is talk of speed. In such a situation, everyone has to invest in the market, hence this phase is called distribution phase.
Smart investors who had already entered the market i.e. entered the market in the accumulation phase, now they start selling their shares, the common people buy the shares sold by them, due to which the smart investor gets their desired price. During this time, whenever the price of the shares starts going up, smart investors sell their shares so that the price does not go up much. This happens again and again and hence the resistance level of the stock becomes here.
Eventually, when the institutional investors sell off all their shares, there is no one left in the market to support the price and hence, after the distribution phase, there is a sharp sell-off in the market, hence this phase is called the mark down of prices. ) is also called. This sharp decline in the market is very disappointing for the general public.
This cycle is completed when the accumulation phase starts again after this sharp decline and this cycle continues in this manner. It is believed that this entire cycle – from the accumulation phase to the cell off phase – can last for a few years.
The point to be noted here is that no two such cycles can be alike. For example, if we look at the Indian context, the bull market between 2006 and 2007 was different from the bull market of 2013 and 2014. Sometimes it takes many years for the market to reach the distribution phase from accumulation but sometimes the whole cycle is completed within a few months. Market players should pay attention to how this phase is going at the moment and plan their strategy accordingly.
The Dow Patterns
Like candlesticks, the Dow theory also has some important patterns. Based on these patterns, traders can find opportunities to trade for themselves. Some patterns we should be aware of are:
The double bottom & double top formation
The triple bottom & triple top
Range formation
Flag formation
Support and resistance are also an essential principle for the Dow theory, although we have already learned about it.
The Double bottom and top formation
Double top and double bottom pattern is considered as a reversal pattern i.e. the trend changes from here. A double bottom is formed when the price of a stock moves past a certain low level and moves back up very quickly from there. After this rapid correction, the stock trades at a high level for about 2 weeks, after that the stock reaches its low level again and if the stock comes up again after reaching its low level then it is called double bottom. Huh.
Double bottom is a bullish pattern and hence stock buyers should look for buying opportunities here. Below in the chart of Cipla Limited you will see a double bottom.

Here, note the time between the two bottom formations, it is clear that some time has passed between the two.
Similarly, in double top formation, a stock tries to touch its low level twice, keep in mind that here too there should be a gap of at least 2 weeks between these two attempts. In the chart below, Cairn India Ltd stock forms double top twice at 336 level. If you look carefully, you will find that the first top was made at 336 and the second top was made at around 332. This difference is sometimes valid and can be considered a double top.

Based on my experience in trading, I can say that double tops and double bottoms are very important and useful especially when double formations are forming with an identified candlestick formation.
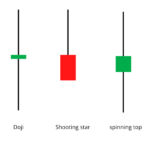
For example, consider a situation where a double top formation is forming and another top is forming on a bearish pattern where there is a shooting star. This means that both the Dow theory and the candlestick pattern are forming simultaneously and pointing in the same direction. In this way your confidence in your trade increases.
The triple top and bottom
You must have guessed that there is a triple top formation just like a double top. The only difference is that the price level is touched not twice but three times. The meaning of triple top formation is also calculated in the same way as that of double top formation.
The more times the stock touches one of its price levels, the stronger the signal is considered, hence the triple top formation is always considered a more important and stronger signal than the double top formation.
The chart below shows a triple top formation of DLF Ltd. Note the sharp selloff after the third top, which confirms the formation of a triple top.

Highlights of this chapter
- The Dow theory has been used in the Western world since before the advent of candlesticks.
- The Dow Theory operates on the basis of its 9 assumptions.
- There are three important phases in the market – accumulation, mark up and distribution phase.
- The accumulation phase is when institutional investments (smart money) enter the market, the mark-up phase is when traders enter the market and the final distribution phase is when the general public enters the market.
- After the distribution phase the mark down starts after which the accumulation phase starts again and this cycle is completed.
- There are also some important patterns in the Dow theory that can be used with candlesticks.
- The double and triple formations are a reversal pattern and are very useful.
- The meaning of double formation and triple formation is calculated in the same way.

Pioneering Excellence as the Best Stock Market Institute in Delhi.
Gaurav Heera is a leading stock market educator, offering the best stock market courses in India. With expertise in trading, options, and technical analysis, he provides practical, hands-on training to help students master the markets. His real-world strategies and sessions make him the top choice for aspiring traders and investors.


