We all learned about average in school, moving average is an extension of that. Moving averages reveal trends and are often used because of their simplicity and effectiveness. Before we get into moving averages, let’s take a quick recap of how the average is calculated.
Let’s say 5 people are sitting in the sun on a beach and enjoying a nice cold syrup. The heat is such that each one of them ends up with several bottles. Assume the final calculation is like this:
| No. | Person | No. of Bottels |
|---|---|---|
| 1 | A | 7 |
| 2 | B | 5 |
| 3 | C | 6 |
| 4 | D | 3 |
| 5 | E | 8 |
| Total Bottels | 29 |
Now suppose a 6th person comes there and looks at the 29 bottles scattered there and tries to find out how many bottles each person drank. He quickly calculates this number by dividing the total number of people by the total number of bottles, in which case the calculation would be: = 29/5 = 5.8 bottles per person. So, in this case, the average tells us roughly how many bottles each person drank. Obviously, there will be some of them who have consumed above average and some who have consumed below average. For example, person E drank 8 bottles of the drink, which is above the average of 5.8 bottles. Similarly, Person D drank only 3 bottles of the drink, which is below the average of 5.8 bottles. Hence the average is only an estimate and one cannot expect it to be accurate.
Taking the same concept further – In Shares, given are the closing prices of ITC Ltd for the last 5 trading sessions. Based on these, the average for the last 5 days will be calculated as follows:
| Date | Closing Price |
|---|---|
| 14/07/14 | 344.95 |
| 15/07/14 | 342.35 |
| 16/07/14 | 344.2 |
| 17/07/14 | 344.25 |
| 18/07/14 | 344 |
| Total | 1719.75 |
Hence the average closing price of ITC over the last 5 trading sessions is 343.95.
The Moving Averages – It is also called the Simple Moving Average.
Now consider a new example where you want to calculate the average closing of Marico Ltd for the last 5 days. The data is as follows:
| Date | Closing Price |
|---|---|
| 21/07/14 | 239.2 |
| 22/07/14 | 240.6 |
| 23/07/14 | 241.8 |
| 24/07/14 | 242.8 |
| 25/07/14 | 247.9 |
| Total | 1212.3 |
= 1212.3 / 5
= 242.5
Therefore the average closing price of Marico over the last 5 trading sessions is 242.5.
Now let’s move on, the next day i.e. 28th July (26th and 27th were Saturday and Sunday respectively) we have a new data. Meaning now there are new 5 days – 22, 23, 24, 25, and 28. We will omit the data for the 21st as we aim to calculate the latest 5-day average.
| Date | Closing Price |
|---|---|
| 21/07/14 | 239.2 |
| 22/07/14 | 240.6 |
| 23/07/14 | 241.8 |
| 24/07/14 | 242.8 |
| 25/07/14 | 247.9 |
| Total | 1212.3 |
= 244.66 = 1223.3 / 5
Therefore the average closing price of Marico over the last 5 trading sessions is 244.66.
As you can see, we have included the latest data (July 28) to calculate the 5-day average, and omitted the oldest data (July 21). On the 29th, we will include the data of 29 and exclude the data of 22, on the 30th we will include the data of 30 but remove the data of 23.
So each time, we are going over the latest data and discarding the oldest one to calculate the latest 5 day average. Hence the name “moving” average.
In the above example, the calculation of the moving average is based on the closing price. Sometimes, moving averages are also calculated using other parameters such as high, low and open. However, most traders and investors use close as it indicates the price at which the market finally closes.
Moving averages can be calculated for any time frame from minutes, hours to years. Any time frame can be selected from the charting software based on your needs.
For those familiar with Excel, here is how the Moving Average is calculated on MS Excel.
| Sale Ref. | Date | Close Price | 5 Days Average | Average Formula |
|---|---|---|---|---|
| D3 | 1-Jan-14 | 1287.7 | ||
| D4 | 2-Jan-14 | 1279.25 | ||
| D5 | 3-Jan-14 | 1258.95 | ||
| D6 | 6-Jan-14 | 1249.7 | ||
| D7 | 7-Jan-14 | 1242.4 | ||
| D8 | 8-Jan-14 | 1268.75 | 1263.6 | =AVERAGE(D3:D7) |
| D9 | 9-Jan-14 | 1231.2 | 1259.81 | =AVERAGE(D4:D8) |
| D10 | 10-Jan-14 | 1201.75 | 1250.2 | =AVERAGE(D5:D9) |
| D11 | 13-Jan-14 | 1159.2 | 1238.76 | =AVERAGE(D6:D10) |
| D12 | 14-Jan-14 | 1157.25 | 1220.66 | =AVERAGE(D7:D11) |
| D13 | 15-Jan-14 | 1141.35 | 1203.63 | =AVERAGE(D8:D12) |
| D14 | 16-Jan-14 | 1152.5 | 1178.15 | =AVERAGE(D9:D13) |
| D15 | 17-Jan-14 | 1139.6 | 1162.41 | =AVERAGE(D10:D14) |
| D16 | 20-Jan-14 | 1140.6 | 1149.98 | =AVERAGE(D11:D15) |
| D17 | 21-Jan-14 | 1166.35 | 1146.26 | =AVERAGE(D12:D16) |
| D18 | 22-Jan-14 | 1165.4 | 1148.08 | =AVERAGE(D13:D17) |
| D19 | 23-Jan-14 | 1168.25 | 1152.89 | =AVERAGE(D14:D18) |
As it is clear, when the closing price changes so does the moving average. The above calculation is also called ‘Simple Moving Average’ (SMA). Since we are calculating it according to the latest 5 days data, it is called 5 day SMA.
Next, this 5-day average (or it can be anything like 5, 10, 50, 100, 200 days) is connected to a line called the moving average line. Lives.
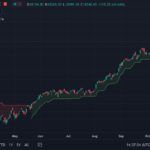
In the chart shown below, I have drawn a 5 day SMA on the candlestick graph of ACC.

So what does a moving average tell and how do you use it? There are many uses of moving averages and soon I will introduce a simple way to trade based on moving averages. But before that, let’s learn about exponential moving averages.
The Exponential Moving Average
Consider the data points used in this example,
| Date | Closing Price |
|---|---|
| 22/07/14 | 240.6 |
| 23/07/14 | 241.8 |
| 24/07/14 | 242.8 |
| 25/07/14 | 247.9 |
| 28/07/14 | 250.2 |
| कुल | 1214.5 |
When one calculates the average over these numbers one assumes that each data point has the same importance. Meaning, we are assuming that the data of July 22 is as important as the data point of July 28. However, this may not always be true in the market.
Remember the basic concept of technical analysis – the market discounts everything. This means that at the latest price (as on 28 July) the market has discounted all known and unknown information. This also shows that the price on the 28th is more reliable than the price on the 25th.
Therefore, weighting of data points should be done on the basis of ‘newness’ of the data. So the 28th July data point gets the highest weightage, 25th July gets the next highest weighting, 24th July gets the third highest weighting, and so on.
By doing this, I have increased the importance of data points according to newness – the newest data point gets the most attention and the oldest data point gets the least attention.
The average calculated on this scale based on the importance or weighting of numbers gives us the Exponential Moving Average (EMA). I intentionally omitted the EMA calculation part, as most technical analysis software allows us to draw the EMA on prices. So we will focus on using the EMA rather than learning how to calculate it.
Here is a chart of Cipla Ltd. I have plotted a 50 day SMA (black) and a 50 day EMA (red) on the closing prices of Cipla. Although both the SMA and the EMA are for a period of 50 days, you can see that the EMA is being influenced more by the prices and hence is closer to the price.

Why does the EMA show the fastest reaction to the current market price? Because the EMA gives more importance to the newest data points. EMA helps the trader to take quick decision. For this reason, traders prefer the EMA over the SMA.
A simple application of moving averages
Moving averages can be used to buy and sell stocks at the right time. When a stock price trades above its average price, it means that traders are ready to buy the stock at a price higher than its average price. This means that the trader expects the value of the stock to rise. Therefore, one should pay attention to buying on such occasions.
Similarly, when the stock price trades below its average price, it means that traders are ready to sell the stock at a price below their average price. This means that traders believe that the stock price may go further down. Therefore, you should look for selling opportunities in such a situation.
Based on these findings we can develop a simple trading system. A trading system can be thought of as a set of rules that help you identify the exact time of entry and exit.
Now we try to build a similar trading system based on 50 day exponential moving average. Remember that a good trading system gives you signals to enter and exit trades. We can develop the moving average trade system with the following rules:
Rule 1) Buy (long) when the current market price i.e. CMP crosses the 50 day EMA. Once you go long, you should stay invested until the sell position is right.
Rule 2) Exit (square off) when the current market price ie CMP is below the 50 day EMA.
Here is a chart that shows the use of this trading system on Ambuja Cements. The black line on the price chart is the 50 day EMA (Exponential Moving Average).

Starting from the left, the first buy opportunity appeared at 165, shown on the chart as B1 @ 165. Note that, at point B1, the stock price has moved up compared to its 50 day EMA. So, as per the trading system first rule, here we can create a new long.
As per the trading system we stay invested until we get an exit signal which we eventually got at 187 which is shown as S1 @ 187. This trade made a profit of Rs 22 per share.
The next signal to go long came at B2 @ 178, followed by a signal to square off at S2 @ 182. The trade was not that impressive as it only made a profit of Rs.4. However the last trades, B3 @ 165, and S3 @ 215 were quite impressive, resulting in a profit of Rs 50.
Here is a summary of these deals done based on the trading system:
| No. | Buy Price | Sale Price | Profit/Loss | %Income |
|---|---|---|---|---|
| 1 | 165 | 187 | 22 | 13% |
| 2 | 178 | 182 | 4 | 2.20% |
| 3 | 165 | 215 | 50 | 30% |
From the above table, it is very clear that the first and last trades were profitable, but the second trade was not so profitable. If you look at why this happened, it would appear that during trades 1 and 3, the stock was moving in one direction, but during the second trade the direction of the stock was not clear (had sideways).
This brings us to a very important conclusion about moving averages. Moving averages work wonderfully when they are in a trend and when the stock is moving without trending sideways, moving averages fail to perform well. Basically this means that moving averages should be treated as a trend-linked system.
From my personal experience of trading based on moving averages, I have noticed some important features:
Moving averages give you multiple trading signals (both buy and sell) during a non-trend (sideways) market. Most of these signals have minor gains or losses.
, but usually one of those trades results in a huge rally (like the trade with B3@165) resulted in huge profits.
It will be very difficult to separate the big winning trades from the many smaller trades.
Therefore the trader should not try to choose profitable trades from those signals. In fact, the trader should place all the trades that the system is suggesting.
Remember that the losses in the moving average trade system are minimal, but one large trade is enough to cover all the losses and can give you substantial profits.
In this profitable trade, you stay as long as the trend remains. Sometimes even for several months. For this reason, moving averages can also be used as a long-term investment.
The key to being successful in a moving average trading system is to make all the trades that the system suggests in the signals, considering them separately and choosing it would be wrong.
Here is another example from BPCL, where the moving average system suggested several trades during a non-trend sideways market, although none of them were actually profitable. But, the last one trade saw a 67% profit in about 5 months.

Moving average crossover system
As is clear the problem with the plain moving average system is that it generates too many trading signals in a sideways market. A moving average crossover system is an improvement over the plain moving average system. This helps the trader to take fewer trades in a sideways market.
In the moving average crossover system, traders combine two moving averages instead of one moving average. This is commonly called smoothing.
A typical example of this would be combining a 50 day EMA with a 100 day EMA. The shorter moving average (50 days in this case) is also called the faster moving average. Whereas the longer moving average (100 day moving average) is called the slower moving average.
The smaller moving average has a smaller number of data points to calculate and therefore tends to be closer to the current market price, and therefore reacts more quickly. There are more number of data points to calculate the long moving average and hence it stays away from the current market price. Hence the reactions are slow in this.
Here is the chart of Bank of Baroda, showing you how the two moving averages when loaded onto the chart

As you can see the black line showing the 50 day EMA is closer to the current market price (it reacts faster) while the pink line showing the 100 day EMA (it is slow reacting) is far away from it .
Traders have also modified the simple moving average system along with the crossover system to improve the entry and exit points. In this process, the trader receives very few signals, but the chances of the trade being profitable are quite high.
The entry and exit rules for crossover systems are as follows:
Rule 1) – The trader should buy (create a new long position) when the short term moving average crosses a long term moving average. Stay in this trade as long as this position persists.
Rule 2) – When the short term moving average falls below the long term moving average in a stock, the long trade should be exited (square off).
Let us apply the moving average crossover system to the BPCL example taken earlier. For ease of comparison, I have reproduced the chart of BPCL with a 50 day moving average.

Note, when the markets were moving sideways, the MA suggested at least 3 trading signals. In this the fourth trade was profitable resulting in 67% profit.
The chart shown below shows the use of the MA crossover system with the 50 and 100 day EMAs.

The black line represents the 50 day moving average and the pink line represents the 100 day moving average. As per the cross over rule, going long is signaled when the 50 day moving average (short time MA) crosses the 100 day moving average (long time MA). The crossover point is highlighted with an arrow. Please note how the crossover system keeps the trader away from 3 unprofitable trades. This is the biggest advantage of the cross over system.
A trader can use any combination or combination to create an MA crossover on the crossover system. Some popular combinations for swing traders are:
9 day EMA with 21 day EMA – use it for short term trades (up to a few trading sessions)
25 day EMA and 50 day EMA together – use this to identify medium term trades (up to a few weeks).
50 day EMA with 100 day EMA – use this to identify trades that last a few months.
200 Days EMA with 100 Days EMA – Use this to identify Long Term (Investment Opportunities), some of them may even last a year or more.
Remember, the longer the time period the smaller the number of trading signals.
Here is an example of a 25 x 50 EMA crossover. Here are three trading signals that are under the crossover rule.

Needless to say, the MA crossover system can also be applied for intraday trading. For example, one can use a 15 x 30 minute crossover to identify intraday opportunities. A more aggressive trader can use a 5 x 10 minute crossover. You must have heard this popular saying in the markets – The trend is your friend. Moving averages help you identify this friend. Remember, MA is a trend-following system – as long as there is a trend, moving averages work wonderfully. It doesn’t matter what time frame you use or what combination you use.
Highlights of this chapter
- Average – is a quickly derived approximation of a series of calculated numbers.
- A moving average calculation where the latest data is included, and the oldest data is excluded.
- Simple Moving Average (SMA) assigns equal weighting to all the data points in the series.
- An exponential moving average (EMA) measures data according to its freshness. The new data gets maximum weightage and the oldest gets the least weightage.
- For all practical purposes, use EMA instead of SMA. This is because the EMA gives more weightage to the newest data points.
- The outlook is bullish when the current market price crosses the EMA. The outlook becomes bearish when the current market price is below the EMA.
- In a market with no trend, the use of moving averages can lead to frequent losses. To overcome this, the EMA crossover system is adopted.
- In an EMA crossover system, the price chart is placed with two EMAs. Short EMAs are faster to respond, while longer EMAs are slower to respond.
- When the faster EMA is above the slower EMA and crosses it, the outlook becomes bullish. So you should consider buying the stock. This trade lasts until the point where the faster EMA starts moving below the slower EMA.
- The longer the time frame for a crossover system, the less likely the trading signals are.

Gaurav Heera is a leading stock market educator, offering the best stock market courses in Delhi. With expertise in trading, options, and technical analysis, he provides practical, hands-on training to help students master the markets. His real-world strategies and sessions make him the top choice for aspiring traders and investors.