Volume Weighted Average Price (VWAP)
VWAP is a very simple indicator. It works based on the average price of the traded volume. Let us understand this with an example.
The trades done in Infy on 2nd November 2016 between 14:30 to 14:35 are shown in the table below –

You will see that 2475 shares were traded at 14:32. It made a high of 983.95, a low of 983, and its closing in this minute was 983.1
Now based on this data we calculate VWAP price. For this we-
- Simple Price = This is the average price of the high, low, and close.
- Volume Price / Price (VP) = For this we need to multiply the simple price by the volume.
- Total Volume Price / Total VP = This is an increasing number (cumulative number) formed by adding the current VP and the previous VP.
- Total Volume = This is also an increasing number obtained by adding the current volume and the previous volume.
- VWAP = We get this number by dividing the total VP by the total volume.
Let’s look at the data of Infy based on this-

You can see that this number is a constantly changing number depending on the number of transactions that are taking place at that time.
How to use VWAP?
- VWAP is an intraday indicator. It should be used on minute charts. When you put it on the chart you will see that at 9:15 minutes there is a jump in it when you are comparing it with the previous day. This jump makes no sense. Don’t pay attention to this.
- The VWAP is an average and like any indicator based on the average, it tends to lag behind the current price.
VWAP is used for 2 specific reasons – to know the intraday direction and to understand the success of your order. - If the current price is below the VWAP then the intraday trend is considered to be in a downtrend.
- If the current price is above the VWAP then the stock is considered to be trending up.
- If VWAP is between high and low, then the stock is expected to remain volatile.
- If you want to short a stock, then shorting at a price higher than VWAP is considered appropriate.
- Similarly, if you want to go long on the stock, then going long at a price lower than the VWAP is considered appropriate.
Using VWAP
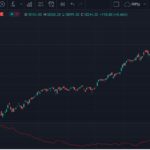
Open the chart of your choice and select VWAP from the studies.

Keep in mind that VWAP can only be used on intraday time frames and not on EOD data.
Once the time frame (1 min, 5 min, 10 min etc.) is selected, the VWAP is calculated and displayed on the chart.
You can now view the VWAP with the current market price and place your trades.

Gaurav Heera is a leading stock market educator, offering the best stock market courses in Delhi. With expertise in trading, options, and technical analysis, he provides practical, hands-on training to help students master the markets. His real-world strategies and sessions make him the top choice for aspiring traders and investors.


