Introduced by John Bollinger in the 1980s, Bollinger Bands (BB- BB) are probably one of the most useful indicators used in technical analysis. BB is used to determine overbought and oversold levels where a trader will try to sell at the upper end of a price band and buy when the price reaches the lower end of the same band.
Bolinger Bands has 3 components:
The middle line is the 20 day simple moving average of the closing prices.
An upper band – this is the +2 standard deviation of the middle line.
A lower band – This is the -2 standard deviation of the middle line.
Standard Deviation (SD–SD) is a statistical concept; Which measures the variance of a particular variable by its average. That is, it tells how far he is from his average. The standard deviation of a stock price shows the volatility of a stock. For example, if the standard deviation of a stock is 12%, it can be said that the volatility of the stock is 12%.
In BB, the standard deviation (SD) is applied to the 20 day SMA. The upper band indicates +2 SD. Using +2 SD, we multiply SD by 2, and add it to the average. For example if the 20 day SMA is 7800, and the SD is 75 (or 0.96%), then +2 SD would be 7800 + (75 * 2) = 7950. Similarly, a -2 SD tells us to multiply the SD by 2 and subtract it from the average. 7800 – (2 * 75) = 7650.
Now we have the components of Bolinger Bands:
20 day SMA = 7800
Upper Band = 7950
Lower Band = 7650
Statistically, the current market price should remain around the 7800 average price. But, if the current market price is around 7950, then it will be considered costlier than the average, so here one should focus on shorting. At the same time, it should be expected that the price will return to its average price.
Hence the trade will be – Sell at 7950 with a target of 7800.
Similarly if the current market price is around 7650, it will be considered cheap in terms of average prices, and therefore should be seen as a buying opportunity. And expect prices to return to average prices.
So the trade would be – buy at 7650 with a target of 7800.
The upper and lower bands act as a trigger to initiate the trade.
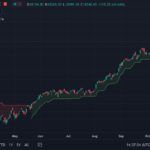
Below is the chart of BPCL Limited:

The central black line is the 20 day SMA (SIMPLE MOVING AVERAGE). The two red lines at the top and bottom are +2 SD and -2SD, like black. When the stock price touches the upper band, it should be short with the expectation that it will return to the average price. Similarly when the price touches the lower band one can go long and expect it to return to the average.
I have highlighted all the signals coming out of the BB with the down arrow indicating sell, although most of the signals were working quite well, there was a time when the price stuck to the upper band. Was gone In fact the price continued to move higher, and so did the upper band of the price. This is called Envelope Expansion.
The upper and lower bands of the BB together form the envelope. Expansion of the envelope occurs when the price indicates strong momentum in a particular direction. BB’s signal fails when an envelope expansion occurs. This leads to an important conclusion that BB works well in a sideways market, and fails in a trending market.
Personally, whenever I use BB I expect the trade to start showing results in my favor immediately. If it doesn’t, then I start to see if the envelope expansion is happening.
Highlights of this chapter
- Bollinger Bands captures variability. It has a 20-day average, a +2 SD and a -2 SD.
- When the current price is at +2SD you can go short with the expectation that the price will reach its average.
- When the current price is at -2SD, you can go along with the expectation that the price will reach its average.
- BB works well in a sideways market. In a trending market, BB’s envelope expansion occurs and generates many false signals.
- It is good to know about the indicator, but it should not be seen as the only source for decision-making.

Gaurav Heera is a leading stock market educator, offering the best stock market courses in Delhi. With expertise in trading, options, and technical analysis, he provides practical, hands-on training to help students master the markets. His real-world strategies and sessions make him the top choice for aspiring traders and investors.