Brief Description
As the name suggests, a single candlestick pattern is a pattern formed from a single candlestick. You can infer that this pattern is formed based on the trading action of a day. Trading based on a single candlestick pattern can be of great benefit if you have identified that pattern properly and executed the trade properly.
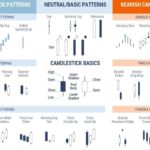
You have to pay close attention to the length of the candle to make such deals. We saw in the last chapter that the length of the candlestick indicates the range of the day, the longer the candle, the more will be the buying and selling of that day. If the candlestick is small then it can be assumed that there was very little trading on that day. The picture below will give you an idea of long and short – Bullish and Bearish candles.

Every trade should also be measured on the length scale of the candlestick. Deals with very small candles should be avoided. We will understand about this in more detail later when we know each pattern.
The Marubozu Candlestick Patterns
The Marubozu is the first single candlestick pattern we need to know about. In Japanese, Marubozu means bald. There are two types of Marubozu Bullish Marubozu and Bearish Marubozu.
Before we go any further, let us once again recall our three concepts related to candlesticks.
Buy strong and sell weak
Keep some flexibility in the pattern, which means there is room for change
See more old trends
Marubozu is probably the only candlestick pattern that does not always satisfy the No. 3 concept. A marubozu can appear anywhere throughout the chart, regardless of the previous trend. Despite this, it does not make any difference to the deal done on its basis.
By definition, a marubozu is a candlestick that does not have an upper and lower shadow. That is why it is called Marubozu, that is, bald. Marubozu only have a real body as you can see in the picture below, although this rule is not always true, and sometimes it is different.

The red candle represents Bearish Marubozu and the blue candle represents Bullish Marubozu.
Bullish Marubozu
The absence of upper and lower shadows in a Bullish Marubozu means – Low equals Open and High equals Close. Open = Low and Close = High means Bullish Marubozu.
A Bullish Marubozu indicates that the market is getting buying and market participants are ready to buy that stock at any price. That’s why the stock closes at its high point. It doesn’t matter what the trend was before it. This type of action indicates that the mood and atmosphere in the market has changed and the stock is now fully bullish.
It is believed that due to this change in mood, there will be an uptrend now and this bullish environment can continue for the next few days. That is why a trader should look for opportunities to buy shares in such a situation. The Buying Price of a share in Bullish Marubozu should be the same as the closing price in Marubozu.

The candle surrounded by (ACC Ltd) in the chart above is a Bullish Marubozu. You will see that there is no upper or lower shadow in the Bullish Marubozu candle. OHLC of this candle is Open = 971.8, High = 1030.2, Low = 970.1, Close = 1028.4
Please note that according to the definition of the book, Open = Low and High = Close. But here in this example, the reality is slightly different i.e. a change from the definition. However, if you look at it in percentage, it is not a huge change, the difference in percentage is just 0.17%. That’s where this second rule applies: Be prepared for the slightest change and check it out.
This marubozu lets you know that the market is bullish and it’s time to buy the stock. The correct prices for this deal would be:
Buy price = near 1028.4 and stop-loss = 970.0
By now you must have understood that the candlestick pattern does not give you any target price. But we will discuss about it in further detail in this module.
Now if we have decided to buy shares after seeing Marubozu, what would be the right time to buy shares? It will depend on what is your risk appetite, there are 2 types of traders in the market – a risk-taker and a risk-averse one.
The risk-taker trader will buy the stock on the day he sees the marubozu even though he has to be sure that the marubozu is actually made. Well, it is very easy to check, Indian market closes at 3:30 PM one has to check that 10 minutes before market close i.e. at 3:20, the current price of the share i.e. CMP is that day’s high price i.e. highest The price and the open price i.e. the price at the time of market opening is equal to the low price i.e. the lowest price. If both these conditions are met then you will know that marubozu has formed in the market on that day and hence you can buy the shares. Your purchase should be near the closing price. It is also important to know that the risk-taking trader is also buying the stock on a bullish day i.e. blue candle day and he is following rule number 1 which says to buy in strength and sell in weakness.
The risk-averse trader will buy the stock when he is sure that the marubozu has been formed on the previous day but before buying the stock he must make sure that the bullish trend remains on the day he is buying because that’s when he follows the rule no.1 will be following. This means that he has to buy the shares when the market is about to close. One of the difficulties with this method of trading is that the buy price is always slightly higher than the suggested buy price. That’s why the stop loss is also very low but this trader is avoiding taking the risk so he makes this deal when he is absolutely sure.
Trading based on the chart of ACC shown above will benefit both the risk taker and the risk-averse trader.
Now let’s look at the Asian Paints chart for another example where both the risk taker and the avoidant trader benefit.

In the example below, a risk-averse trader would make a profit.

The chart above shows you a Bullish Marubozu surrounded by a circle. The risk-taking trader will place his trade on the same day around the time of market close. But it will hurt him the next day. On the other hand, a risk-averse trader will wait for the next day and see that the next day is a red candle day, that is, a bearish day and thus he will be saved from buying the stock and making losses.
You must remember that we have to buy on the day of the blue candle and sell it on the day of the red candle.
Stoploss in Bullish Marubozu
What if the stock changes direction after you buy in the market and the deal turns upside down? I have already said that candlestick patterns have their own mechanism of risk aversion. In Bullish Marubozu, the lowest price of the stock acts as its stoploss. If you are making a deal to buy a stock and the market moves to the other side then you should exit your stock when that stock breaks its low in the Bullish Marubozu i.e. goes below the lowest price.
Let’s look at an example of a Bullish Marubozu indicating a buy deal, both for the risk taker and the risk averse trader.
OHLC is: O = 960, H = 988.6, L = 959.85, C = 988.5.

But the Marubozu pattern is not formed here and the trade results in a loss. The stoploss for this deal will be Marubozu’s Low i.e. lowest price of 959.85. . By the way, sometimes making losses in deals is a part of stock trading and even very experienced players sometimes incur losses. But the biggest advantage of trading on the basis of a candlestick is that the loss does not last very long, it is very clear when you have to close your trade and exit. Exit is the best route in this deal shown in the above example as the stock is continuously going down. However, it may also happen that after your stoploss, that is, after you exit the stock, the stock changes its direction and starts moving upwards again. But you cannot avoid this because it is also a common practice in the market. The special thing is that whatever is happening in the market, you must follow your rules and not find a way to escape from them.
Bearish Marubozu
Bearish Marubozu means that the market is in a bearish state. Here open equals high and close equals low. The Bearish Marubozu suggests that the selling mood among the market participants is so high that the market participants want to sell at any cost and exit. Because of which the stock closes near its lowest price. In such a situation, it does not matter what was the trend before it. The Bearish Marubozu indicates that the mood has changed and the market is bearish. Here also it is expected that this change in mood will continue for the next few days and the stock will continue to be bearish. In such a situation, opportunities should be found to short the stock and the selling price in the short should be around the closing price of that day.

The (BPCL Ltd) circled candle in the chart above indicates that a Bearish Marubozu is present. This candle also does not have upper and lower shadows. As we have already mentioned that slight fluctuations in the OHLC figures are not a big deal, just that its range should be small i.e. the variation should not be much. This time, on the basis of this marubozu, the trade of shares (BPCL) will be to sell and the price to short will be Rs 341.70. Also, the stoploss will be at the highest price of that day’s candle i.e. Rs 356. Though we haven’t learned to set the target price yet and we will learn it in the next module but remember once you have placed a trade, you have to hold until either the target is hit or the stoploss is hit. If you do something before either of these hits, your deal may turn upside down. So it is very important to have this discipline.
The deals will be done based on your risk-taking ability. A risk-taker trader can initiate a trade on the same day if he sees a Bearish Marubozu in the candle. For this, he has to make sure around 3:20 pm that Open = High and the current market price (CMP) is the lowest price of that day’s market. If it looks like this it means Bearish Marubozu is certain and can take a short position. If the trader wants to avoid the risk, he will wait till the next day’s closing. He will create his short position the next day around 3:20 when he will come to know that this day is also a red candle day thus he will be able to follow the first rule i.e. buy in strength and sell in weakness.
Both the risk taker as well as the averse trader will benefit from a trade based on the above BPCL chart.
Now let’s look at another chart on Cipla Ltd where the Bearish Marubozu will be beneficial for both the risk taker and the avoidant trader. Remember here that these are short-term trades going for a short period of time and profits should be taken out as quickly as possible.

Now let’s look at a chart in which there is a Bearish Marubozu but a trader taking a risk will not make money in this trade, while a trader who is risk averse will avoid doing this trade.

Trade Trap
At the beginning of this chapter, we talked about candle length. If the candle is very small i.e. its range is below 1% or if the candle is very large and its range is more than 10%, then one should not trade. A small candle means that very few trades are taking place at that time and in such a situation it is difficult to understand the direction of the trade. Similarly, when the candle is long, it means that there is a lot of trading going on, it is very difficult to set stoploss. In this environment, your stoploss will be huge and you can lose a lot if the trade turns against you. That is why it is better not to trade at the time of big and small candles.
Highlights of this chapter
- Remember the rules designed for the correct working of the candlestick.
- Marubozu is a stand-alone pattern that does not follow rule number 3 i.e. can reverse from the previous trend.
- A Bullish Marubozu indicates a bullish trend.
- Buy Marubozu at the closing price of Rs.
- Place a stoploss at Marubozu’s low.
- Bearish Marubozu suggests bearish.
- Sell Marubozu near closing price.
- Place a stoploss at the higher price of Marubozu.
- A trader willing to take a risk can take a trade on the day he sees a marubozu forming.
- The trader who takes less risk takes his trade the next day when he sees the completion of the first rule i.e.
- buy in strength and sell in weakness.
- Do not trade when the candlestick is too small or too big.
- Smaller candles mean less turnover.
- Large candles mean a lot of trading, making stoploss difficult.

Gaurav Heera is a leading stock market educator, offering the best stock market courses in Delhi. With expertise in trading, options, and technical analysis, he provides practical, hands-on training to help students master the markets. His real-world strategies and sessions make him the top choice for aspiring traders and investors.