The Engulfing Pattern
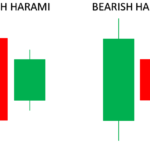
In a single candlestick pattern, a trader needs only one candlestick based on which he/she can find trading opportunities, but in multiple candlestick patterns, the trader sometimes needs to identify two or three candlesticks to spot his/her chances. This means that the trader has to look at the pattern of 2 or 3 trading sessions i.e. two or three days of trading to spot the opportunity. The very first multiple candlestick pattern that we will see is the engulfing pattern. It takes at least 2 sessions for the engulfing pattern to form. In this, on the first day, you will see a short candlestick and on the second day, you will see a long candlestick pattern. It seems that the candlestick of the second day has covered or encircled the candlestick of the first day i.e. engulfed. If the engulfing pattern is formed on the downside of a trend then it is called the Bullish engulfing pattern and if the engulfing pattern is formed in the upward direction then it is called the Bearish engulfing pattern.
The Bullish Engulfing Pattern
A Bullish Engulfing Pattern is a 2 candle pattern that forms on the downside of a trend. As the name suggests, this is a bullish pattern, and traders should buy and follow it. The chart below shows an encircling 2-day Bullish Engulfing pattern. The special features of this pattern are:
The earlier trend should be downwards.
The first day (P1) pattern should be a red candle indicating a bearish mood in the market.
The candle for the second day (P2) should be a blue candle that can completely cover or engulf the red candle.

The Thinking Behind the Bullish Engulfing Pattern:
- The market is bearish and the prices are slowly going down.
- On the first day of the pattern (P1) the market opens lower and makes a new low, forming a red candle.
- On the second day of the pattern (P2) the stock opens near the closing price of the first day and tries to make a new low. But a buy occurs at this low, which moves the price above the previous day’s open (P1) and closes, resulting in a blue candle.
- The change in the price on the second day (P2) also indicates that the bulls are firmly in the market, they have worked hard to take the price up and break the bearish trend and they are successful in taking the price higher. have also happened. Because of this, the blue candle becomes tall.
- Bears did not expect that the bulls would do any such thing and hence the bears get a little nervous about the action of the bulls.
- This new bullish environment is expected to continue for the next few days of trading due to which there is a scope for the price to move higher, therefore, traders should look for buying opportunities in the market.
In the Bullish Engulfing Pattern, the trade setup would look like this:
- Bullish Engulfing Pattern is formed in 2 days.
- The suggested buy price will be equal to the close price of the blue candle (P2).
- A risk-ready trader will start his trade on the second day i.e. P2 when he sees that the candle on P2 is engulfing the candle on P1.
- The risk-averse trader will start his trade on the next day i.e. a day after P2 when he sees that day is also a blue candle day.
- If the day after P2 happens to be a red-colored candle day, the risk-averse trader will not place his trade as he will follow the candlestick rule number 1 “Buy in Strong and Sell in Weakness”.
- Personally, I feel that in multiple candlestick patterns that are formed over 2 or more days, it is more beneficial to be a risk-taker than a risk avoider.
The stoploss of the trade will be the lowest of both P1 and P2.
Remember here that you have to hold your trade till the target or stop loss is reached. However, sometimes the stop loss may have to be trailed in order to make gains.
Take a look at the chart of DLF below where a bullish engulfing pattern is shown encircled.

Here is the OHLC:
P1 – Open = 163, High = 168, Low = 158.5, Close = 160
P2- Open = 159.5, High = 170.2, Low = 159, Close = 169
How will the deal turn out in the engulfing pattern?
- The risk taker trader would buy at 169 on day P2 but before doing so he would see that the engulfing pattern is forming, to check that two conditions are met
- The current price (CMP) at 3:20 pm on the day of P2 should be higher than the open price of the first day (P1).
- The open of the second day (P2) should be equal to or below the close of the previous day (P1).
- The risk-averse trader will start his trade the day after P2 when he sees that it is also a blue candle day. This means that if P1 is on Monday then the risk-averse trader will open his trade on Wednesday at 320. However, as I have said earlier, in multiple candlestick patterns, it is better to start your trades on P2 i.e. the day after the pattern is formed.
- The stoploss of the trade will be the lowest low between P1 and P2, as in this example the lowest low is on P1 at 158.5.
In this example, both the risk taker and the risk-averse trader will benefit.
Let’s see an example of a very nice Bullish Engulfing Pattern that is formed on the chart of Cipla Ltd. A trader trying to avoid risk will completely miss out on this good opportunity.

There is a lot of doubt about whether the candle should only engulf or cover the real body completely or whether it should cover the real body as well as the lower and upper shadows. Based on my personal experience I can say that if the real body has turned engulfing from the candle then it is a Bullish Engulfing pattern. Yes, it is true that those who believe in the book definition of candle stick will not agree with my opinion and will also object. But the important thing is that how do you hone your skills and be able to make good trades by looking at a candlestick pattern.
Continuing my view, I would also consider the chart below to be a bullish engulfing pattern, although the shadows here are not completely engulfed.

The Bearish Engulfing Pattern
A Bearish Engulfing Pattern is a pattern consisting of two candlesticks that form on the upside of a trend, making it considered bearish. The thinking behind this is the same as that of the Bullish Engulfing Pattern with the only difference being that it is seen as an opportunity to short.
Look carefully at the chart below, here two candles are forming a bearish engulfing pattern, which we have shown surrounded.

Here you will see that:
- In the beginning, the market is completely controlled by the bulls and they are taking the price higher.
As expected the market is going up and a new high will be formed which will indicate that the market is in a bullish trend. - On the second day (P2) the market will open higher as expected and try to make a new high. But at this high, there will be a sell-off in the market and due to this selling pressure, the prices will start coming down. The sudden sell-off will reduce the impact of the bulls.
- Sellers will push the price down and move it down enough that the stock closes below its previous day’s (P1) open. This will cause some panic among the bulls.
- A sudden sharp selloff on P2 suggests that the bears have broken the bulls’ hold on the market and hence it can be expected that the market will remain under selling pressure for the next few days.
- In such a situation, an attempt should be made to go short on the index or stock so that the price fall can be taken advantage of.
Now the deals will go like this:
- The Bearish Engulfing Pattern advises you to go short.
- The trader who takes the risk will start the trade on the same day only he has to see two things.
- The open of P2 should be above the close of P1.
- The market price should be below the open price of P1 at 3:20 minutes on day P2. If both these conditions are met then it means that it is a Bearish Engulfing Pattern and the trade is likely to go ahead.
- The risk-averse trader will place his trade the day after P2 when he sees that that day is also a red candle day.
- Since the Bearish Engulfing Pattern is a two-day pattern, it is better that you be a risk-taker, but this decision will have to be made by yourself.
Now take a look at a chart of Ambuja Cement below. It has two bearish engulfing patterns. The first pattern is on the left that is circled, this pattern is not working for the risk-taker and the risk avers will not make the deal. The second Bearish Engulfing pattern on the right side will prove to be beneficial for both types of traders.

The OHLC for the Bearish Engulfing pattern above is: …
P1: Open – 214, High – 220, Low – 213.3, Close – 218.75
P2: Open – 220, High – 221, Low – 207.3, Close – 209.4
Based on this Bearish Engulfing Pattern, the short trade will be made like this…
- The risk-taker will short 209 on the day of P2 at 3:20 pm but will first ensure that P1 and P2 are forming a bearish engulfing pattern.
- The risk-averse will make sure the day after P2 is a red candle day and then place his/her short trade.
The stoploss in both the deals will be the highest level of P1 and P2, which in this case is at 221. - Both the risk-averse and the risk-taker will benefit in this trade.
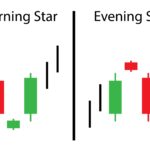
The Presence of a Doji
Now here is a very interesting chart. From my personal experience, I can tell you that charts like the one shown below are very beneficial. Such trades or deals should not be abandoned.
Take a look at the chart, what are the things that catch your attention?
- The upward acceleration is highlighted.
- Bearish Engulfing Pattern at the top of the rally on an uptrend
- Formation of a Doji on the day after P2
What would be the effect of having a Doji in this chart?

Let’s look at the events in this chart one by one:
- The long-term bullishness in the chart indicates that the bulls are in control of the market.
- A blue candle is formed on P1 which indicates that the bulls are in control.
- On P2 the markets open up and go to a new high which again proves that the bulls are in control. However, selling pressure builds up at the highs and the pressure becomes so high that prices close below the open prices of P1.
- This volatility in trading P2 has caused a bit of panic for the bulls, but their confidence is not broken yet.
- On the third day, we call it P3, although the opening is weak but it is not much lower than the close of P2.
- But for the bulls, this situation is not going to be comfortable, as they expected the markets to be strong.
- During P3 the market tries to move up (an upper shadow of the Doji) however does not hold up. Even the lows don’t last and eventually, the day ends flat with a Doji. As you know Doji indicates indecision in the market.
- On P2 the bulls were nervous and on P3 the bulls were uncertain.
- Fear coupled with uncertainty is the perfect recipe for mayhem. Which is visible from the long red candle after the Doji.
From my own personal trading experience I can tell you that whenever a Doji follows a well-known candlestick pattern, it is a huge opportunity. In addition to this, I would also like to draw your attention to the method of chart analysis. Notice in this chart, we didn’t just look at what was happening on P1 or P2 but have tried to look beyond that by combining two different patterns and taking a look at the whole market.
The Piercing Pattern
Both the piercing pattern and the bullish engulfing pattern are similar, with only one very minor difference. In a bullish engulfing pattern, the blue candle on P2 completely covers the red candle on P1. Whereas, in a piercing pattern P2’s blue candle only partially covers P1’s red candle, yes the covering should be more than 50% and less than 100%. You can also view it and calculate it. For example, if P1 has a range (open-close) of 12, then P2 must have a range of at least 6 or higher, but below 12.

Only one condition must be met, except that everything is the same as in the Bullish Engulfing Pattern, even the trades. Here a risk taker will initiate his trade around the close of P2. The risk-averse will place his trade only after seeing a blue candle after P2, and the stoploss will be the low of this pattern.
Take a look at the following chart:

Here the blue candle on P2 covers a little less than 50% of the red candle on P1, so we do not consider this a piercing pattern.

The Dark Cloud Cover
The dark cloud cover pattern is similar to the bearish engulfing pattern but there is a difference. In a bearish engulfing pattern, the red candle on P2 has completely covered the blue candle on P1. Whereas in the dark cloud cover pattern, the red candle on P2 is only about 50 to 100% of the blue candle on P1. The trade setup will be exactly the same as in the Bearish Engulfing Pattern. Dark cloud cover can be considered the reverse of the piercing pattern.

A Perspective on Choosing a Trade or Deal
Usually, the shares of the same sector have similar movements. For example, think of TCS and Infosys or ICICI Bank and HDFC Bank. Their price changes are the same because these companies are more or less the same size, in the same business, and all the external factors that affect their business are also the same. But that doesn’t mean their stock price will match every move. For example, if there is bad news in the banking sector, banking stocks may fall. In such a situation, if the share price of ICICI Bank falls by 2%, then it is not necessary that the share price of HDFC Bank also falls by 2%. Probably HDFC Bank’s share price may fall by 1.5% or 2.5%. Therefore two stocks can form 2 different (but somewhat similar) candlestick patterns such as Bearish Engulfing Pattern and Dark Cloud Cover at the same time.
These are both well-known candlestick patterns, but if I had to choose between these two patterns for my trade, I would rather invest my money in the Bearish Engulfing Pattern than the Dark Cloud Cover. This is because the bearish engulfing pattern is bearish more clearly (that is because it covers the entire candle of the previous day). Similarly, I would choose a Bullish Engulfing Pattern over a Piercing Pattern.
There is one exception to this scale of my choosing, however. Later in this module, I will introduce the 6 point trading checklist. A trade must meet at least 3 to 4 points on this checklist to be considered a good trade. With this in mind, let’s assume there is a situation where ICICI Bank stock forms a piercing pattern and HDFC Bank stock forms a bullish engulfing pattern. Naturally, a Bullish Engulfing Pattern would be considered a better opportunity to trade, but if HDFC Bank stock satisfies 3 checklist points, and ICICI Bank stock satisfies 4 checklist points, then I would go with ICICI Bank stock I will move forward even if it forms a less reliable candlestick pattern…
On the other hand, if both the stocks satisfy the 4 checklist points then I will go ahead with the HDFC Bank trade.
Highlights of this chapter
- Multiple candlestick patterns are formed over two or more days.
- The Bullish Engulfing Pattern develops over two trading days. It appears at the lower end of a bearish trend.
- The first day is called P1 and the second day is called P2.
- In a Bullish Engulfing Pattern, P1 is a day with a red candle, and P2 is a day with a blue candle. P2’s blue candle completely covers P1’s red candle.
- A risk-taker will place a buy position on P2 just before the market close, after noticing that P1 and P2 are forming a bullish engulfing pattern. The risk-averse trader will place his trades around the close of the market on the day after P2.
- The stoploss for a Bullish Engulfing Pattern will be the lowest low between P1 and P2.
- A bearish engulfing pattern appears at the upper end of a bullish trend. P1’s blue candle appears completely covered or surrounded by P2’s red candle.
- A risk-taker will place his short trade on P2 at market close but after first observing that P1 and P2 are forming a bearish engulfing pattern. The risk-averse trader will initiate the trade on the day after P2, after confirming that it is a red candle day.
- The highest highs of P1 and P2 form the stoploss for the bearish engulfing pattern.
- The formation of a Doji following an engulfing pattern further accentuates the pattern.
- The piercing pattern and the bullish engulfing pattern work similarly, except that the red candle on P2 covers between 50% and 100% of the blue candle on P1.

Gaurav Heera is a leading stock market educator, offering the best stock market courses in Delhi. With expertise in trading, options, and technical analysis, he provides practical, hands-on training to help students master the markets. His real-world strategies and sessions make him the top choice for aspiring traders and investors.