Average True Range (ATR) was developed by J Wells Wilder. It is used to measure volatility of the market. Wilder took commodities and daily prices into account as well, while creating the ATR. Commodities generally show more volatility than stocks. Among them, gap opening () and limit move () are more. This happens when a commodity opens as high or low as its limit of opening up or down. The formula for measuring volatility, which is based on high and low, is not able to accurately describe the fluctuations of the gap or limit. That’s why Wilder created the ATR. Remember that ATR does not indicate the direction of the price but only shows the volatility.
What do you need to know?
- ATR is an extension of the True Range Principle.
- There is no upper or lower limit in ATR. It can show any value.
- ATR varies for each stock price. Meaning, ATR for Stock No. 1 can be 1.2, while ATR for Stock No. 2 can also be 150.
- ATR tries to measure volatility and not price direction.
- ATR can also indicate stoploss.
- If the ATR of a stock is 48, it means that the stock can generally move 48 points up or down. You can find the range of the stock price of that day by putting it in the range of a particular day. For example, if the stock price is 1320 then the stock will be between 1320-48 = 1272 and 1320+48 = 1368.
- If the next day’s ATR becomes 40, then it means that the volatility is decreasing and the range of the stock will also decrease.
- ATR is best used to identify volatility-based stop losses. For example, suppose you decide to buy a stock at 1325, then your stoploss should be 1272 as the ATR is 48.
- Similarly, if you have decided to go short at 1320 then your stoploss should be 1368.
- If these stop-losses do not fit your risk to reward then it is better to leave such trades.
How To Use Average True Range:
As you can see the default value of ATR is showing as 14. This means that the ATR for the last 14 days has been calculated. Well, you can change it according to you.
When you load the chart, the ATR appears at the bottom of the price chart.

So the next time you place a stoploss, make sure to check it with ATR. My advice would be to read more about volatility and its uses.
Average True Range Band
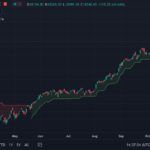
ATR band is an extension of ATR. The ATR band calculates the upper and lower bands and tries to find out if there is any unusual movement in the price of the stock or if it is not trending in a particular direction. For this an envelope is created around the stock price and seen.
What do you need to know?
- The ATR band is calculated by creating an upper and lower envelope around the stock price.
- First, the moving average () of the stock price is calculated.
- The value of ATR is added to the moving average and this forms the upper envelope.
- The value of ATR is subtracted from the moving average and this forms the lower envelope.
- If the stock price crosses the lower or upper envelope, it is expected that the stock price will continue to move in the same direction. For example, if the stock price has crossed the upper envelope, then the stock is expected to move upwards.
- The ATR bands can also be used in place of the Bollinger Bands trading system ().
Using Average True Range Bands:

When you load the ATR band, you will have to fill a few other things as well.
The moving average time frame has to be entered in the period, although the default value is 5 days, but you can change it according to your need. Our advice would be to leave the shift as it is. Select close in the field as this will show you the moving average of the closing price. All the rest of the information has been asked to beautify the chart, you can try it yourself using it. When you click on Create, the ATR band will be created on the chart.

Gaurav Heera is a leading stock market educator, offering the best stock market courses in Delhi. With expertise in trading, options, and technical analysis, he provides practical, hands-on training to help students master the markets. His real-world strategies and sessions make him the top choice for aspiring traders and investors.


