Correlation and its types
The pair trading technique that we are going to discuss now has been discussed by Mark Whistler in his book “Trading Pairs”. This book attracted me towards pair trading and gradually my interest in it increased. I tried to learn this strategy beyond Mark Whistler’s technique. I will discuss those techniques later in this module. But right now my effort is to teach you pair trading in the same way in which I have learned it.
At the end of the previous chapter, we discussed the principle of correlation and analysis of correlation values. Now we will take this forward and understand how the correlation of two stocks is calculated. By now you must have understood that the biggest key to pair trading is the calculation of the correlation of those 2 stocks.
For this, I have taken Axis Bank and ICICI Bank as an example. Both are private sector banks and come from similar business environments. Hence, it can be assumed that the correlation between the two stocks will be quite good.
Right now, I have downloaded the closing closing prices of Axis Bank and ICICI Bank from 4 December 2015 to 4 December 2017. This is a data span of about 2 years and has 496 data points. Before we proceed further, here are some important points to keep in mind about this data –
You need to ensure that the number of data points is equal. For example, if you have taken 400 data points for stock A, you need to ensure that stock B also has 400 data points and their dates are the same.
Also ensure that the data is balanced by adjusting for corporate actions like bonuses or splits.
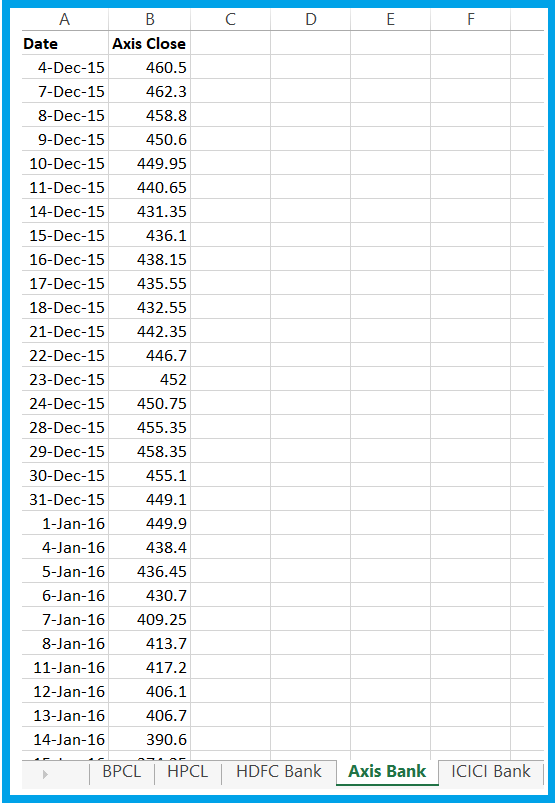
As you can see, apart from ICICI and Axis Bank, I have also extracted data for BPCL, HPCL and HDFC Bank. You can also use this data to find some other correlations.
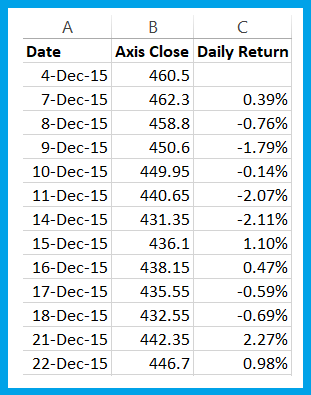
For now, we have only date and closing price data. Now we will calculate daily returns. I hope you know how to calculate daily returns, we have seen and learnt this many times in earlier modules.
To calculate daily returns –
= {today’s closing price / previous day’s closing price} – 1
[today’s closing price / previous day’s closing price] – 1
I have calculated this for both ICICI Bank and Axis Bank –
To calculate correlation, two standards or parameters have to be determined –
Daily closing price or every day’s closing price
Daily return series i.e. series of returns of every day
To calculate the correlation of daily closing price, you have to calculate the correlation based on the closing price of both the stocks. I do not like calculating correlation based on closing price. But let us learn it now.
To calculate it in Excel, you just have to use the ‘=Correl()’ function on the daily closing price data. I am calculating it on a new sheet which I have named ‘Pair Data’, see –
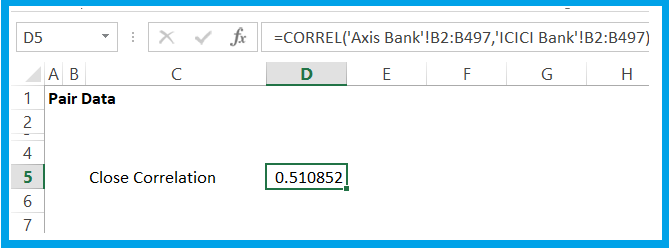
The correlation between the closing prices of ICICI Bank and Axis Bank is 0.51. This correlation is not very good but we will manage with it for now. Recall that we thought the correlation between these two banks will be quite strong because their business is similar but their correlation numbers are not showing a very good picture.
Now we will calculate the correlation based on the daily % return series of both the stocks. I have already calculated the percentage return, now I just need to use the ‘=Correl()’ function.
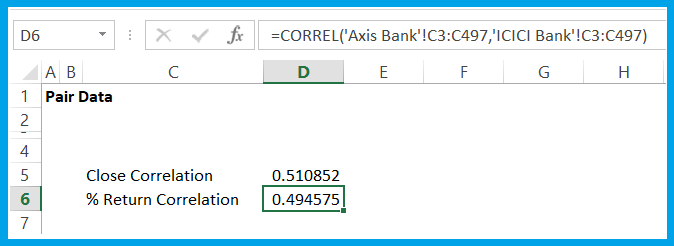
Again, this number does not look very encouraging to us. But let’s leave it at that for now.
Some traders use absolute per day change for correlation, which is calculated on the basis of ‘Today’s stock price – yesterday’s stock price’. I don’t like this method too much either. But take a look at this for now –
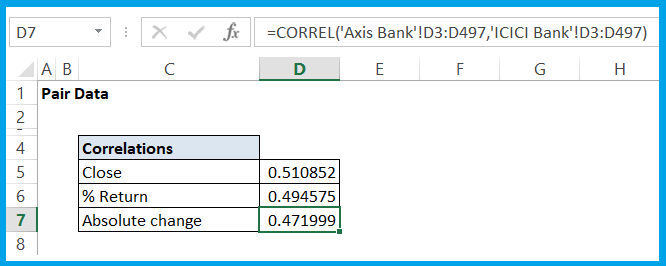
In all the above calculations, I have calculated the correlation between Axis Bank and ICICI Bank. The result obtained is similar to the correlation between ICICI Bank and Axis Bank. That is, the correlation between A and B will be the same as the correlation between B and A.
The correlation number is very important in this method of pair trading. Generally, this number should be above 0.75. You have already seen that the correlation between ICICI Bank and Axis Bank is not that much. But let’s make do with this for now.
Creating a Data Sheet
In the previous chapter, we discussed the three components of a pair, spread, differential and ratio. Now let’s calculate these three components for the two stocks we are discussing. We will calculate this on a separate sheet in the same workbook and name that sheet – Data Sheet. See –
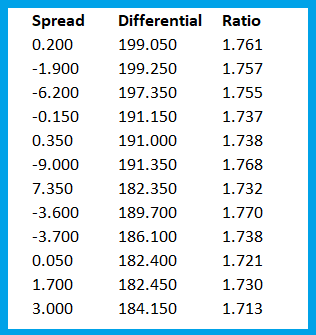
This calculation is quite simple and I explained it in the previous chapter.
Different types of pair trading have different complexities. For now, we are using simple level statistics. But now we will define the three most commonly used statistical variables.
Basic Stats
Now we will discuss three simple or basic statistical terms. It is very important for you to know them because they play a very important role in pair trading. It is quite possible that you have studied about them in high school. Even if you do not remember, they are quite simple and not difficult to understand.
To understand them, I have prepared a sheet which shows the number of runs scored by a batsman in the last 10 matches.
| Match | Run |
|---|---|
| 1 | 72 |
| 2 | 65 |
| 3 | 44 |
| 4 | 100 |
| 5 | 82 |
| 6 | 55 |
| 7 | 100 |
| 8 | 23 |
| 9 | 51 |
| 10 | 34 |
Mean – Also known as the arithmetic mean/average, it indicates the average of a set of scores. You can find the mean by adding all the scores together and then dividing the result by the number of scores.
So, if I have to find the mean of the example given in the table above, then the number obtained by adding the runs scored in all 10 matches will have to be divided by 10.
Mean = 626 / 10
= 62.6
To find this on an Excel sheet, just use the ‘=Average()’ function.
Median – If a set of numbers is arranged according to scores, then the number that falls in the middle of that series is called the median. If a series of numbers contains even numbers, like 2, 4, 6, 8, 10 (there are 10 numbers in our example too), then the middle two numbers are added and their average is calculated and that is the median. But if the series contains odd numbers, then the middle number is the median.
So, let us calculate the numbers in our above example according to their digits
23, 34, 44, 51, 55, 65, 72, 82, 100, 100
Here we have even numbers, so the middle two numbers 55 and 65 are added and their average is calculated and that is the median.
Median = ( 55 + 65) / 2
= 60
The Excel function to calculate median is ‘=Median()’
By looking at mean and median together, we can identify the trend. We will discuss this later.
Mode – The number that occurs the most in a data series is the mode of that series. For example, in our example, 100 occurs twice and all other numbers occur only once, so 100 will be the mode.
The Excel function for this is ‘=Mode()’
In the next chapter, we will use all these functions in Excel and understand their importance in pair trading.
The Excel used in this chapter can be downloaded from here.
Key points of this chapter
- Note that the data has been corrected according to corporate action.
- The correlation calculated on the basis of the closing price of both the stocks is called the close correlation.
- The correlation calculated on the basis of the daily % return series of both the stocks is called the % return correlation.
- The arithmetic average of a group of numbers is also called the mean.
- After arranging a group of numbers according to their digits, the number that falls in the middle of the series is called median.
- If a group of numbers contains even numbers, then the average of the two middle numbers is calculated and that is the median.
- If a series contains odd numbers, then the middle number is the median.
- The number that occurs the most frequently in any data series is the mode of that series.
- By looking at the mean and median together, we can identify the trend of the data.

Gaurav Heera is a leading stock market educator, offering the best stock market courses in Delhi. With expertise in trading, options, and technical analysis, he provides practical, hands-on training to help students master the markets. His real-world strategies and sessions make him the top choice for aspiring traders and investors.