The three candlestick patterns that we will study are the Morning Star and the Evening Star. Before we understand the Morning Star pattern, we need to understand two common principles of price movement – the gap up opening and the gap down opening. A gap (a general term used to describe both a gap up and a gap down) is a common movement of price movements in the market. A gap on the daily chart occurs when the stock closes at a different price but opens the next day at a completely different price with a big change.

The Gaps

Gap up opening – Gap up opening shows the bullish mood of the buyers in the market. This indicates that buyers are ready to buy the stock at a price higher than the previous day’s close. Due to this buyer’s mood, the stock (or index) opens much higher than the previous day’s close. For example, the closing price of ABC Ltd. on Monday was Rs.100. ABC Limited announced its quarterly results after the market closed on Monday. The results are so good that on Tuesday morning buyers are ready to buy this stock at any price. Because of this, the stock price jumps straight to Rs 104. Though the trading was not taking place between the price of Rs 100 and Rs 104, the stock jumped to Rs 104. This is called a gap-up opening. Gap up opening indicates a bullish mood.
The gap-up opening is shown with the green arrow in the picture below.

Gap down opening – Like the gap up opening, the gap down opening also shows the enthusiasm of the market – but the enthusiasm of the sellers i.e. the bearers. This suggests that the bears are so eager to sell, that they are willing to sell at a much lower price than the previous day. In the example above, if the quarterly results were bad, the sellers would want to get rid of the stock and hence the stock could open straight at 95 on Tuesday instead of the market price of Rs 100. In this case also, though there was no trading between Rs 100 and Rs 95, the stock fell to Rs 95. A gap down indicates a bearish mood.
The gap-down opening is shown with the green arrow in the picture below.

The Morning Star
Morning Star is a Bullish candlestick pattern that develops over three days. This is a Downtrend reversal pattern, that is, a pattern indicating the stop of the bearish trend. This pattern is formed by combining 3 consecutive candlesticks. Morning Star appears at the lower end of a bearish trend. The chart below shows a circled Morning Star. The Morning Star pattern consists of 3 candlesticks in a specific order. The pattern is shown in the circle above in the chart. Here’s the thinking behind Morning Star:

- The market is completely under the control of the bears and is trending bearish. The market continues to make new lows during this period.
- As expected, on the first day of the pattern (P1) the market makes a new low and forms a long red candle. The big red candle shows an increase in selling.
- The gap down opening on the second day (P2) of the pattern also shows bears in control.
- After the gap down opens, nothing happens during the day (P2) resulting in either a Doji or a Spinning Top. Remember that the Doji / Spinning Top indicates indecision in the market.
- The formation of a Doji/Spinning Top creates a bit of restlessness within the bears, as they were expecting another bearish day, especially after the gap-down opening.
- On the third day of the pattern (P3), the market/stock opens a gap up followed by a blue candle that closes above the red candle opening of P1.
- If P2 does not form a Doji or a Spinning Top, it would appear that P1 and P3 have formed a Bullish Engulfing Pattern.
- All the action in the market comes to the P3. The bears get a little nervous at the gap-up opening. After the gap up, buying continues during the day, buying so high that all losses on P1 are offset.
- The P3 uptrend is expected to continue over the next few trading sessions and hence the market should look for buying opportunities.
Unlike the one and two candlestick patterns, both risk-takers and risk-averse traders can initiate their trades only on P3. While trading based on the Morning Star pattern, it is not necessary to wait for the confirmation of the pattern on Day 4.
The long trade setup for Morning Star would be as follows:
Initiate a long trade near the closing of P3 (around 3:20 PM), after making sure that P1, P2, and P3 together form the Morning Star.
The following conditions must be met in order to be confirmed as a Morning Star:
- P1 should be a red candle.
- With the gap-down opening, P2 should be either a doji or a spinning top.
- P3 should be the gap up opening, with the current market price (CMP) at 3:20 pm should be higher than P1’s open price.
- The lowest take in the pattern will act as a stoploss for this trade.
The Evening Star
The evening star is the last candlestick pattern that we will learn in this module.
The Evening Star is similar to the Morning Star, except it is a bearish pattern. The evening star appears at the upper end of a bullish trend. Like the Morning Star, the Evening Star is a three-candle pattern and develops over three trading sessions.

The reasons for shorting the Evening Star are as follows:
- The market is completely controlled by the bulls and a bullish trend is in the market.
During this bullish market/stock makes new highs. - As expected on the first day of the pattern (P1), the market opens higher, makes a new high, and closes near the day’s high. A long blue candle formed in the day (P1) also shows an increase in buying.
- On the second day of the pattern (P2), the market gap opens which reaffirms the bulls trend in the market. But, after this excitement, the market/stock does not move and closes by forming a Doji/Spinning Top. This poor close of P2 makes the bulls a little nervous.
- On the third day of the pattern (P3), the market opens downwards and moves into the red candle. The long red candle indicates that the bears are taking control of the market. A price reversal on P3 creates panic among the bulls.
- The expectation is that the bulls will remain nervous and hence bearish for the next few trading sessions. In such a situation, short opportunities should be found.
The trade setup for Evening Star is as follows:
Short P3 near market close at 3:20 PM, just to see that P1 and P3 together form an evening star.
To confirm that P3 is made of the evening star:
P1 should be a blue/bullish candle.
P2 should give a gap-up opening and form a doji or a spinning top.
P3 should form a red candle with a gap-down opening. Also, the price (CMP) of P3 at 3:20 should be lower than the open price of P1.
Both risk-takers and risk-averse traders can initiate trades on P3.
The stoploss for this trade will be the highest level of P1, P2, and P3.
Summary of Entry and Exit for Candlestick Patterns
Before we conclude this chapter, let us once again look at the key points of entry and stoploss for both long and short trades. Remember that during candlestick study we have not talked about exit from trade. We will do this in the next chapter.
Risk-taker – The risk-taker enters the trade around the close price on the last day of pattern formation (3:20 pm). The trader should confirm the pattern and once confirmed can trade.
Risk aversion – The risk-averse trader will initiate the trade after seeing the next day’s candle of the pattern. The candle color should be blue for long trades and red for short trades.
As a rule you can follow, the higher the number of days involved in a pattern, the better it is for a trader to trade on the same day that the pattern is formed.
The stoploss for a long trade is the lowest level of the pattern. The stoploss is the highest level of the pattern for the short trade.
What Next?
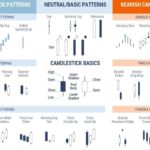
We studied 16 candlestick patterns, but are there all the same patterns?
Not really. There are many candlestick patterns and I can explain these patterns but this will not give us our target.
Our ultimate goal is to understand and recognize that candlesticks are a way of forming an outlook on the markets. You don’t have to know all the patterns.
For example, once you learn to drive a car, it doesn’t matter which car you drive. Driving a Honda car is similar to driving a Hyundai or a Ford car. Once the car is driven, driving happens naturally no matter what car you’re driving. Similarly, once you have trained your mind to understand the thinking behind a candlestick, it does not matter what pattern you are looking at. You will know how to react and set up trades based on that chart. Of course, to reach this level, you have to go through the experience of learning the pattern and trading based on it.
So my advice to you is to know the patterns which we have discussed here. These are the most profitable patterns to trade in the Indian markets and are used frequently. Understand the thought process of Bulls and Bears as you progress and start developing trades based on that. This is the best way to study candlesticks.
Highlights of this chapter
- Star formation occurs in three trading sessions. The P2 candle is usually a doji or a spinning top.
- If a doji is formed on P2 in the star pattern, it is called a Doji star (Morning Doji Star, Evening Doji Star), otherwise it is simply called a star pattern (Morning Star, Evening Star).
- Morning Star is a bullish pattern that occurs at the lower end of the trend. This creates a long trade. The stoploss for this trade will be the lowest low of the pattern.
- An evening star is a bearish pattern that forms at the top of a trend. In this, it is better to short on P3. The stoploss in this trade will be the top high of the pattern.
- The star is formed in 3 days, so both risk-takers and risk-averse traders are advised to initiate trades on P3.
- The candlestick shows the trader’s thinking. The more you read the candlestick and understand it, the stronger your outlook (about the market) will also be.

Gaurav Heera is a leading stock market educator, offering the best stock market courses in Delhi. With expertise in trading, options, and technical analysis, he provides practical, hands-on training to help students master the markets. His real-world strategies and sessions make him the top choice for aspiring traders and investors.