Once again – Density Curv
First of all, let us review what we have learnt so far so that there is no confusion in anyone’s mind. My advice would be to read it carefully.
If two companies operate in the same type of business environment (background), they can be compared.
Business environment or background refers to the things that are faced every day while running a business.
If the business background of two companies is similar, then it can be assumed that the share price of both of them will show almost similar movements.
If the share price of two companies moves in the same way every day and their daily returns also look similar, then it shows that there is a strong correlation between them.
At times, a single event can change the price movement of one of the two companies and then there is an opportunity for pair trading.
Any of the three components – spread, differential or ratio – can be used to estimate the relationship between two companies.
It is assumed that these three components will be normally distributed, so their standard deviation is calculated. Also, some statistical data like mean, median and mode are calculated.
Apart from this, to keep an eye on the pair at all times, we can also create a standard deviation table which can go up to 3rd standard deviation on both sides.
Finally, remember that we are going to discuss two different methods of pair trading. The first is Paul Wissler’s pair trading technique and after that I will discuss a slightly more difficult pair trading technique.
So that’s all we have learned so far. Now in this chapter we will further discuss about Density Curve and the triggers of pair trading.
Choosing the right variable
We now come to the point where we need to choose between spread, differential and ratio.
This is important because we want to create a single methodology, rather than getting bogged down with too many variables and getting different signals. I mentioned all three to let you know that any of them can be used. But as a trader, you have to decide which one you can use best and which you trust. Personally, I like ratio more than differential or spread. This is because I know that ratio also takes into account the share price, i.e. the latest valuation of the stock. Also, ratio gives us an idea of how much of stock 1 should be bought or sold in relation to stock 2.
For example, if the price of Stock 1 is 190 and the price of Stock 2 is 80, then the ratio of Stock 1 and Stock 2 is –
190 / 80
= 2.375
This means that for every share of Stock 1, 2.375 shares of Stock 2 should be traded. We will discuss this in detail later. But hopefully, you have got an idea now.
You can choose either spread, differential or ratio. But for the sake of our discussion, I am going ahead with ratio for now.
Trade Trigger
You know that pair means a pair, which means two stocks. So far, we have not discussed how a pair can be bought or sold. We will discuss this later in the chapter. For now, just assume that just like you buy or sell a single stock, you can buy or sell a pair in the same way.
As you know, the decision to buy or sell a pair is based on the variable you are tracking. This variable can be spread, differential or ratio. For our discussion in this chapter, we have chosen ratio.
You know that the price of a stock changes every day and hence the ratio of a pair also changes every day. Most of the time, this ratio remains within a certain range. But sometimes, there may be a day when the change of that day goes out of that range. This is the day when there is an opportunity for pair trading.
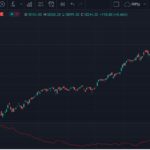
Take a look at the chart below –
Even a cursory look at the chart will reveal two things –
The chart of the ratio is moving between 1.8 to 2, it is possible that the mean of this ratio is around it. I have shown this with a green line. I would advise you to go to the previous chapters where we calculated the mean of the ratio and see it.
Most of the time the ratio remains above or below the mean
Now here you have to consider a very important thing. If you understand this, then it will be very easy for you to understand other things related to pair trading.
The ratio is calculated by dividing the price of one stock by the price of another stock, because the price of the stock keeps changing every day, so the ratio also keeps changing every day. If you make a chart of the changes in the ratio every day, then you will see that the ratio has an average i.e. mean and it keeps moving above or below it. Wherever the ratio is today, below or above the mean, there is always a chance that the ratio will revert to the mean in the next few days. Note that I said there is a high chance that this will happen, which means we can measure the probability.
When this happens, it is called Mean Reversion or Reversion to Mean.
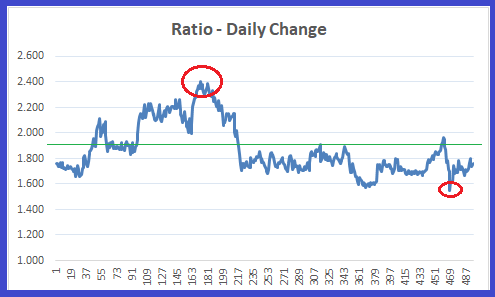
I have circled in red the two points in the chart where the ratio has moved away from the mean. The first circle from the left is where the ratio has moved far above the mean. The second circle from the left shows where the ratio has gone below the mean value. However, in both cases, the ratio eventually returned to the mean.
If you look at it from another perspective, based on this, we can form an opinion about the direction in which the ratio is going to move. For example, in the first circle, when the ratio went above the average or the mean, this situation tells us that the ratio will revert to the mean. In other words, you can short the ratio at that high and buy it when it comes back down to the mean. Similarly, the second circle is where you can buy the ratio and hope that the ratio will revert back to the mean.
You have to look at the ratio as a stock or futures. If we know the direction of the ratio’s movement, then we can easily place our trades according to its direction of movement.
I hope you understand this point.
Where the ratio is in relation to the mean is what gives us the trigger for the trade. If the ratio is:
Above the mean, we can expect the ratio to revert to the mean, so you can short the ratio
Below the mean, we can expect the ratio to revert to the mean, so we can go long on the ratio.
Now some questions:
If the ratio is always above or below the mean, does that mean there is a trading opportunity all the time?
At many places, it seems that the ratio has either bottomed or peaked, how do we know where to start trading?
The answer to these questions is called the density curve. Let’s look at it.
Density Curve
Take a look at this chart:
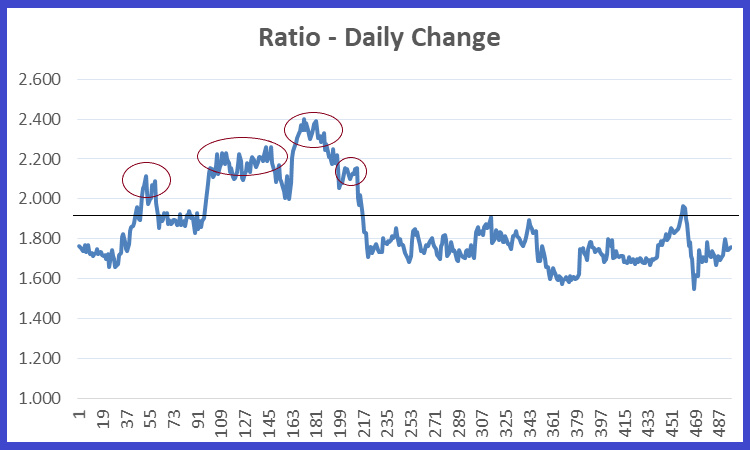
I have highlighted four points on this chart. At all these points the ratio is trading above the mean. Suppose you look at the chart at the point where I have drawn the first circle. Would you initiate a trade just because the ratio is above the mean? This question may arise whenever the ratio is above or below the mean.
It would be great if we could do such a trade. But for this we will have to watch the ratio very closely and enter the trade when the probability of mean reversion is the highest. That is, we will have to enter the trade when we are very confident that the ratio will come to the mean very soon.
This is just like a lion hiding in the bushes and about to pounce on its prey. Just because the prey is in the open, the lion will not attack it and will not miss the chance to kill it. It will attack only when it is sure that it will be able to kill the prey.
So it is important to know how to prepare for the attack and how to attack at the right time.
For this, we have to once again look at the normal distribution and its characteristics. I hope you are aware of it. But let us have a brief look at it –
In the 1st standard deviation you can see 68% of the data
In the 2nd standard deviation you can see 95% of the data
In the 3rd standard deviation you can see 99.7% of the data
So how will this be used in the context of ratio –
Wherever the ratio is compared to the mean, it has its own standard deviation. For example, the ratio may be just a few points away from the mean and this distance may be 0.5 standard deviations from the mean.
If the ratio goes to the 2nd standard deviation, then according to the normal distribution, there is only a 5% chance that it will go higher. This means that there is a 95% chance that the ratio will revert to the mean.
Similarly, if the ratio goes to the 3rd standard deviation, there is only a 0.3% chance that it will go higher. We can say that there is a 99.7% chance that the ratio will revert to the mean.
So, at each standard deviation, we can estimate how likely the ratio is to approach the mean. This means that whenever we see an opportunity, we can find out how likely it is that a trade will be successful here and can only enter a trade if there is a good chance of success.
Another important point that emerges is that where the ratio is compared to the mean – trade cannot be done only on this basis, the standard deviation also has to be seen. That is, we can say that instead of tracking the ratio every day, it would be better if we track the standard deviation of the ratio every day.
In this tracking, we are useful – Density Curve. Density curve is never negative. It is always between 0 to 1.
It is quite simple and easy to calculate the density curve on the Excel sheet. You can calculate it like this, have a look at the picture below
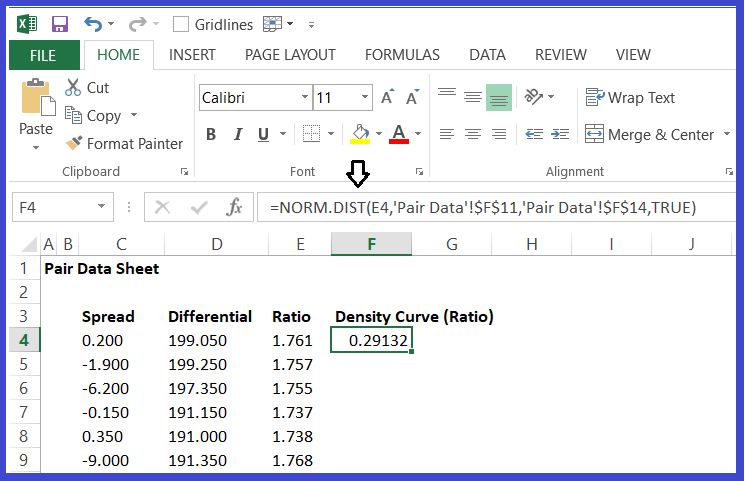
If you want, you can use the function Norm.dist given in Excel for this. In this function, you have to give 4 inputs –
X – Daily value of the ratio
Mean – Mean or average value of the ratio
Standard Deviation – Standard deviation of the ratio
Cumulative – Here you have to choose True or False. Always choose True as default
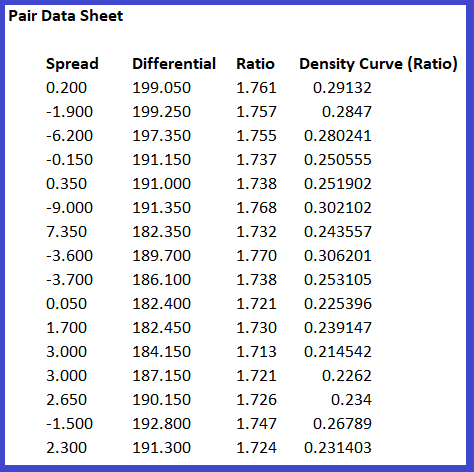
I have calculated the density curve for all the variables, have a look at the table below –
We now end this chapter. In the next chapter we will see how the density curve can be used to trigger pair trades for short and long.
Key points from this chapter
- Ratio is a better variable because it also includes the price of the stock.
- Ratio is always above or below its mean value.
- It is assumed that when the ratio moves away from the mean, it is likely to revert back to the mean.
- Whenever the ratio moves away from the mean, you can calculate the probability of reversion to the mean.
- Reversion to the mean can be calculated from the normal distribution.
- The density curve is a non-negative number that lies between 0 and 1. This can be easily calculated using Excel.

Gaurav Heera is a leading stock market educator, offering the best stock market courses in Delhi. With expertise in trading, options, and technical analysis, he provides practical, hands-on training to help students master the markets. His real-world strategies and sessions make him the top choice for aspiring traders and investors.