In 1995 Tushar Chande created an indicator named Arun to tell whether a stock is trending or not and how strong that trend is. Arun is a Sanskrit word which means the morning aura or the first ray. Chande chose the name because through it he wanted to mark the beginning of a new trend. The Arun indicator measures the period over which the price has made a high or low. There are two types of indicators – Aroon-Up and Aroon-Down.
The 25 day arun up measures the days from the 25 day high to the present. Similarly, 25 days Arun Down counts the days from the 25 days low till now. The Aroon indicator differs from a regular Momentum Oscillator in that it looks at time in terms of price, while other momentum oscillators look at price in terms of time. The Aroon indicator can be used to identify new trends and consolidation, define periods of correction, and anticipate reversals.
What do you need to know about Aroon Indicator?
- This indicator measures the days since the last high or low, that is, looks at the time according to the price.
- Arun has two parts – Arun Up, and Arun Down.
- Arun is usually 25 days old. Arun Up measures the days from the 25-day high to the present, while Arun
- Down measures the days from the 25-day low.
- Arun Up and Arun Down are formed side by side on a chart.
- Aroon up/down can be 0 (zero) at the bottom and 100 at the top.
- A buy signal occurs when Aroon Up is above 50, or Aroon Low is below 30.
- A sell signal occurs when arun down is above 50, and arun up is below 30.
How to Use Aroon Oscillator?
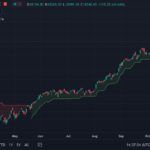
The picture below shows what this indicator looks like when loaded with studies-

As you can see the default period is showing as 14 days. You can change it according to your need. Remember that if this period is 14 days, then Arun is indicating how many days have passed since the 14 day high or low.

You can see that both Aroon Up and Aroon Down are together.
Arun Oscillator
The Aroon Oscillator is an extension of the Aroon indicator. Aroon measures the difference between the oscillator and the aroon up and down and shows it as an oscillator. This oscillator rotates between -100 to 100 and 0 is its focal point. The Aroon Oscillator is shown in the chart below.

An oscillator above 0 means that Aroon Up is greater than Aroon Down, meaning that prices have been making new highs more frequently in the past few days. Conversely, being below 0 means that Aroon Down is greater than Aroon Up, meaning prices are making more new lows than new highs.
As you can see the Aroon Oscillator will usually be either positive or negative. Because of this it becomes easy to read this oscillator. Time and price both show bullishness when this indicator is positive and bearish when this indicator is negative. At what number this indicator is positive and negative, it shows how strong the trend is. For example, above 50 means there is strong bullishness, while below -50 means that there is strength in the bearish.

Gaurav Heera is a leading stock market educator, offering the best stock market courses in Delhi. With expertise in trading, options, and technical analysis, he provides practical, hands-on training to help students master the markets. His real-world strategies and sessions make him the top choice for aspiring traders and investors.