It is an indicator that indicates the absence of a trend, the absence of a direction, or the absence of a trend. Bill Williams first recognized the behavior of the alligator and described it as a form of market that behaves like an alligator. Meaning, the period of rest that comes when the crocodile falls asleep after eating food. In the same way, after the change in the price in the market, there comes a period of lethargy i.e. gold. Just as the longer a crocodile sleeps, the more hungry it becomes, so the longer the market stays in the dormant phase, the stronger the upcoming move.
What do you need to know?
The Alligator indicator is placed above the price chart.
This indicator is made up of 3 Simple Moving Averages (SMA) – 13,8 and 5.
The moving average of period 13 denotes the jaw of the alligator, the moving average of period 8 denotes the teeth of the alligator, and the moving average of period 5 denotes the lip of the alligator.
13 mA is colored blue, 8 mA is red and 5 mA is green.
A buy signal is generated when-
- All three MAs are different
- Price is above 5 MA, 5 MA – above 8 MA, and 8 MA – above 13 MA
- When the above conditions are met, it means that the asset is trending up
- When the uptrend is confirmed, the trader should look for a good entry point
A sell signal is generated when-
- All three MAs are different
- Price is below 5 MA, 5 MA – below 8 MA, and 8 MA – below 13 MA
- When the above conditions are met, it means that the asset is trending down
- When the downtrend is confirmed, the trader should look for a good entry point
- A time when the 13,8 and 5 MA are in a flat zone is called a no trader zone, and the trader should stay away from the market.
Using the Alligator indicator:
Load the alligator indicator with studies. When you load the MA of 13,8 and 5 will be loaded automatically.

You will notice that the indicator input also shows an Offset Value for each MA, which is loaded automatically. Offsetting or displacing the moving average reduces the number of whipsaws in the average. You can change the moving average and offset whenever you want. If you want, you can also add their color according to your own.
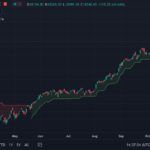
Above we have shown what this indicator looks like when mounted on top of a chart. Sell conditions are being met at two positions (shown in red) and buy conditions are being met at one position, which is shown in blue.

Gaurav Heera is a leading stock market educator, offering the best stock market courses in Delhi. With expertise in trading, options, and technical analysis, he provides practical, hands-on training to help students master the markets. His real-world strategies and sessions make him the top choice for aspiring traders and investors.