Linear Regression – An Introduction
In the previous chapter, we explained the Straight Line Equation. We tried to explain how the relationship between two variables can be determined using very simple examples. The examples were so simple that you could know the relationship between them just by looking at them. At the end of the chapter, we showed a table of two variables and raised the question of how to establish a relationship between them. Here, how do we find the value of slope and intercept i.e. E?
In this chapter, we will find a way to establish this relationship and move towards the relative value trading technique. For everyone’s convenience, I am putting that table again –
| X | Y |
|---|---|
| 10 | 3 |
| 12 | 6 |
| 8 | 4 |
| 9 | 17 |
| 20 | 36 |
| 18 | 22 |
There is no connection between them at first sight.
In such a situation, we use the Linear Regression technique. In this statistical technique, two sets of numbers are given as input, and as output we get a lot of information including intercept and constant numbers from which we can make a straight line equation.
We can use Excel to calculate Linear Regression. The method of calculating Linear Regression of two sets of numbers in Excel is given below.
Install the Plugin
Open a new Excel sheet and enter the values of X and Y as shown in the table above. As I have shown below –
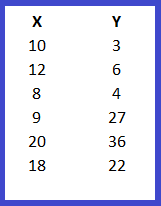
This is our data. Remember that Y becomes a dependent variable whose value depends on the independent variable X. Both X and Y will be used as inputs for linear regression.
Click on the Data ribbon (shown by red circle) in the Excel sheet, as shown in the image –
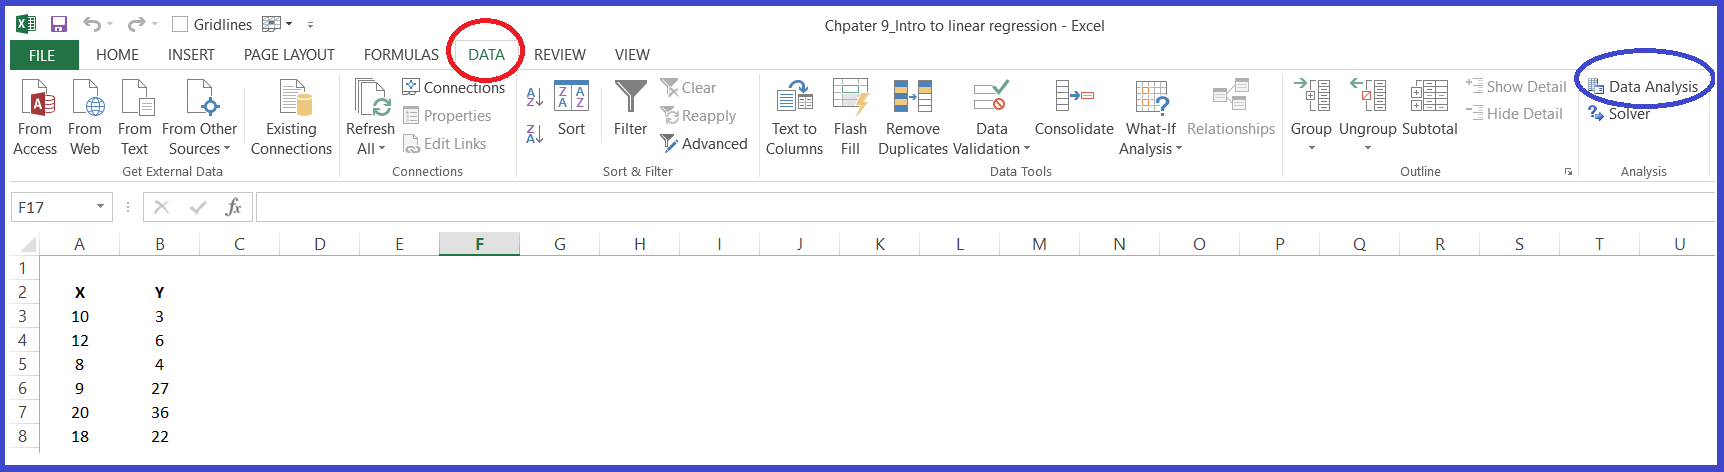
The Data ribbon will now give you the option of Data Analysis. It is highlighted in blue. Some of you may not see this option. If this is the case then there is no need to panic, all you have to do is –

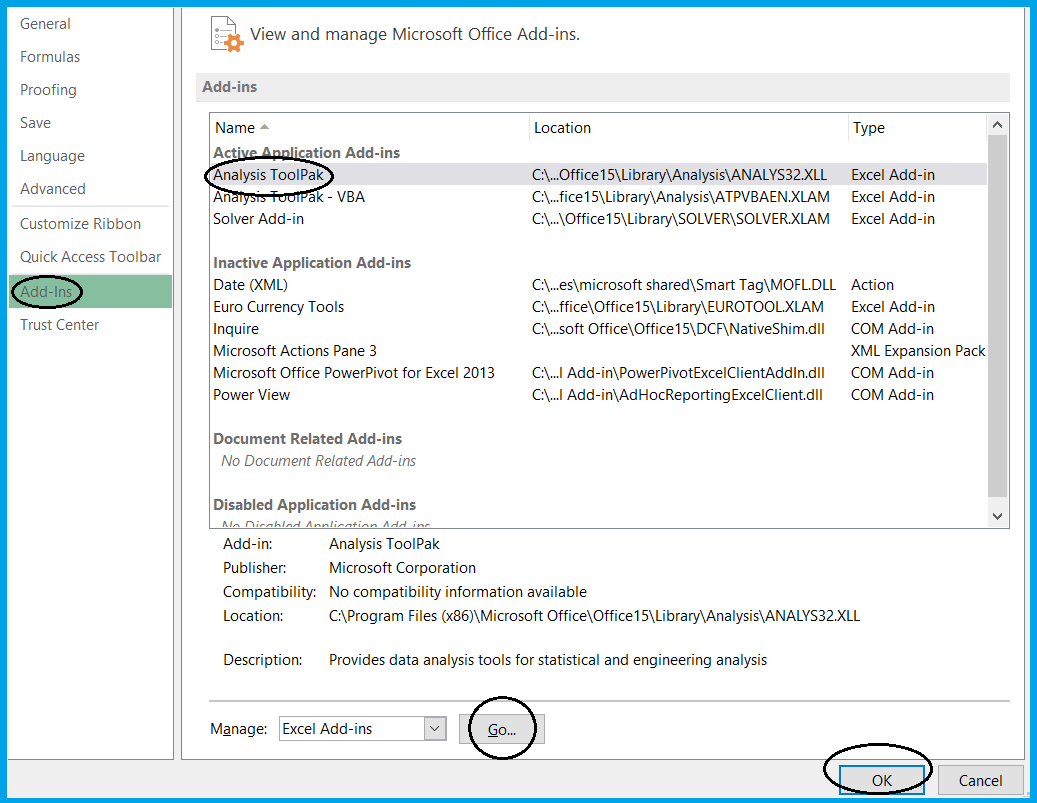
After this a new window will open and you will see this option in the left side panel

On clicking this option, you will get many options. Out of these, you have to click on Add Ins in the left side panel and then press the Go button and then finally click on OK. In this way you will be able to add Data Analysis to the Data Ribbon.
Now close the Excel sheet and restart your computer. Now you are ready.
Enter the Values
Now you have a data analysis pack in your Excel sheet. Now you have to use the linear regression function in the data analysis pack. For this, click on the data ribbon, and select data analysis. After this a pop up will open in which you will see a list of many operations that you can use in the data set. You have to select regression from it.
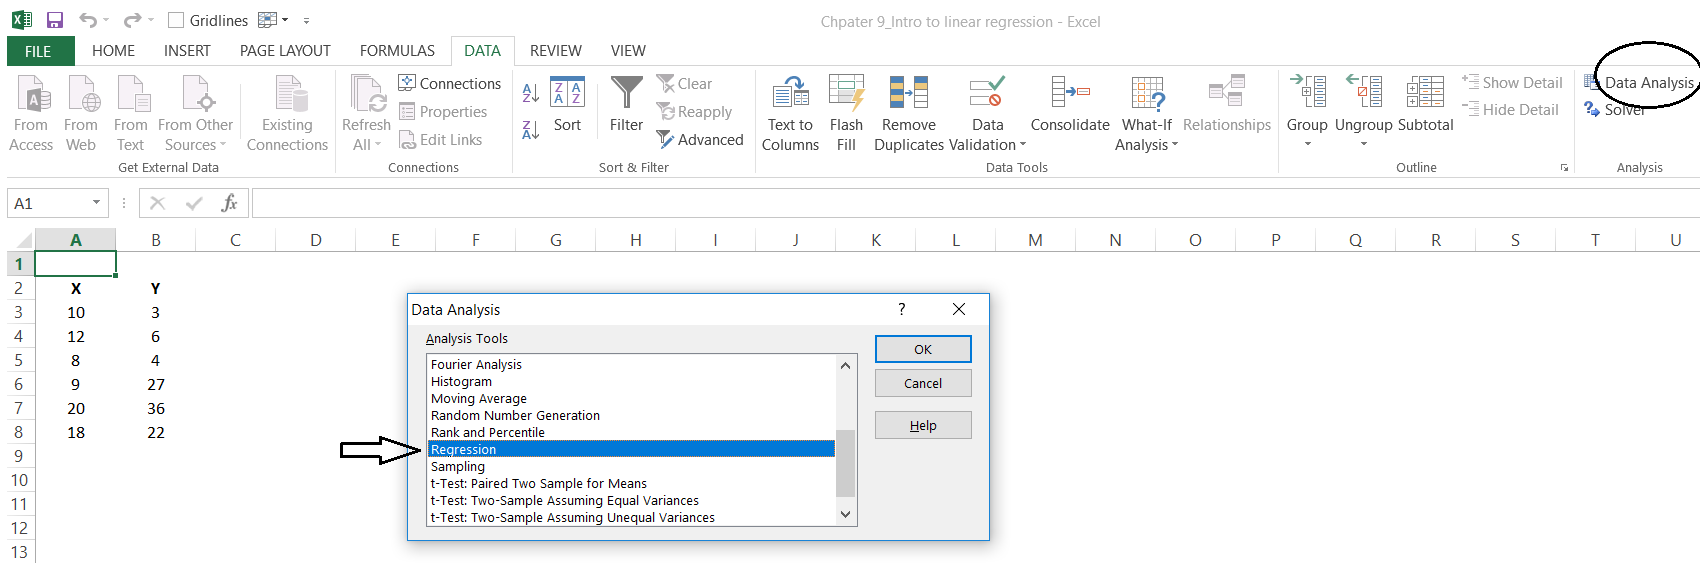
After selecting regression and pressing OK you will see this pop up.
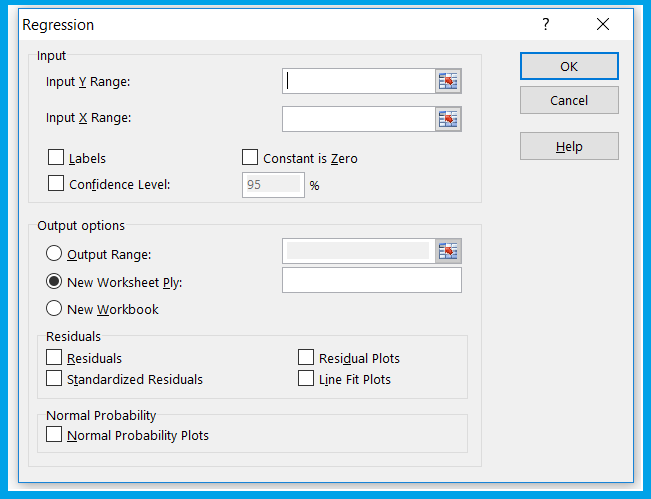
As you can see there are a lot of fields here. You have to pay attention to the first section, which is the input section. There are two fields in it – Input X Range and Input Y Range. You must have understood that Y is for dependent variable and X is for independent variable.
This is where we have to fill the data of X and Y series. For this, click on the input channel and select X Range and Y Range.
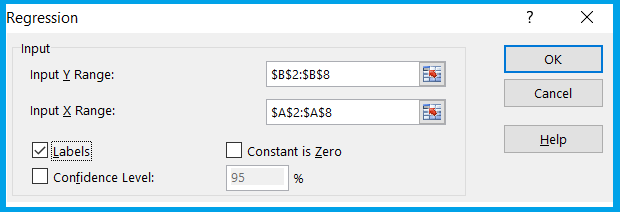
Notice here that I have ticked the Label box, this indicates that the value of the first cell i.e. A2 and B2 are the values of the series i.e. X and Y.
I suggest you ignore the rest of the inputs.
On the output side, you must select this –
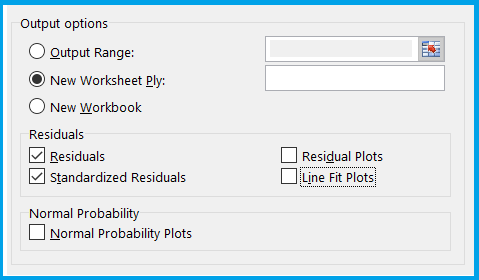
Selecting new worksheet will give you your output data in a new worksheet. I have also ticked Residuals and Standardised Residuals here. We will discuss what these are later, for now just select them.
Now you are ready to perform the linear regression operation. Click on the OK button at the top right.
Excel will now take these inputs and perform the linear regression operation. The result will be available in a new sheet in the same workbook.
Linear Regression Output
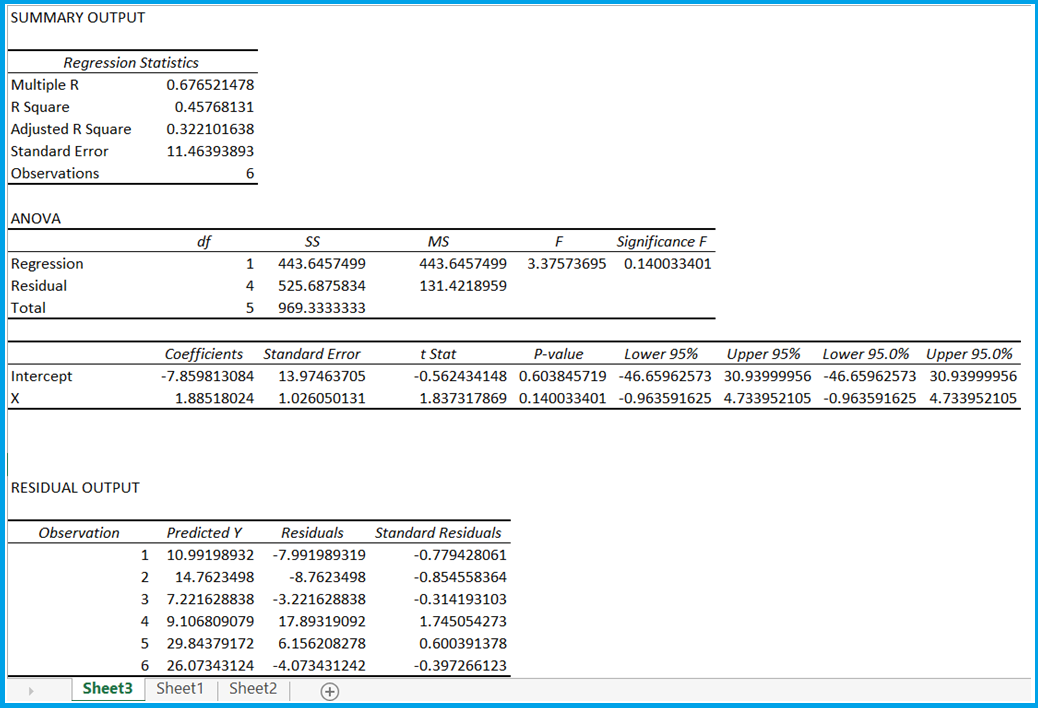
The output of linear regression will look like this, the summary of this output will be in a new sheet.
I know this might be intimidating. There is a lot of information. We will take it in small pieces as we go along.
But for now, let’s look at the slope and intercept. I have highlighted these in the image below –
The coefficients highlighted in red are the intercept (constant) and slope (X).
Here slope is represented by X and that can be confusing but don’t let it confuse you. If X was replaced by M then it would have been fine for a straight line equation but we will have to make do with X.
So,
Slope of the equation = 1.885
Intercept (Constant) = 7.859813
Based on this, the straight line equation for our data will be –
y = 1.885*x + (-7.859813) or
y = 1.885*x – 7.859813
So what does this mean?
You might remember that in the previous chapter we said that this equation helps us find the value of Y i.e. the dependent variable based on X. Let’s take a look at our table again –
| X | Y |
|---|---|
| 10 | 3 |
| 12 | 6 |
| 8 | 4 |
| 9 | 17 |
| 20 | 36 |
| 18 | 22 |
| 15 | ?? |
I have entered a new value of X as 15 here, now using slope and intercept we can find the value of Y.
Y = 1.885 * 15 – 7.859813
= 28.275 – 7.859813
= 20.415
So now if the value of X is 15 then the value of Y will be 20.415.
You might wonder how accurate this value is.
So remember this is just an estimate so don’t assume it to be completely correct. For example, suppose the value of X is 18, then the value of Y according to the straight line equation will be –
y = 1.885*18 – 7.859813
= 33.93 – 7.859813
= 26.07019
But its actual value is given as 22.
This means that Y will have two values –
Predicted value of Y according to the straight line equation
Actual value of Y
The difference between these two values is called Residuals. For example, when the value of X is 18, then the residual value of Y (difference between the actual value of Y and the predicted value) will be –
26.07019 – 22
= 4.070187
When you calculate linear regression, you also get residuals in its output. I have highlighted it below –
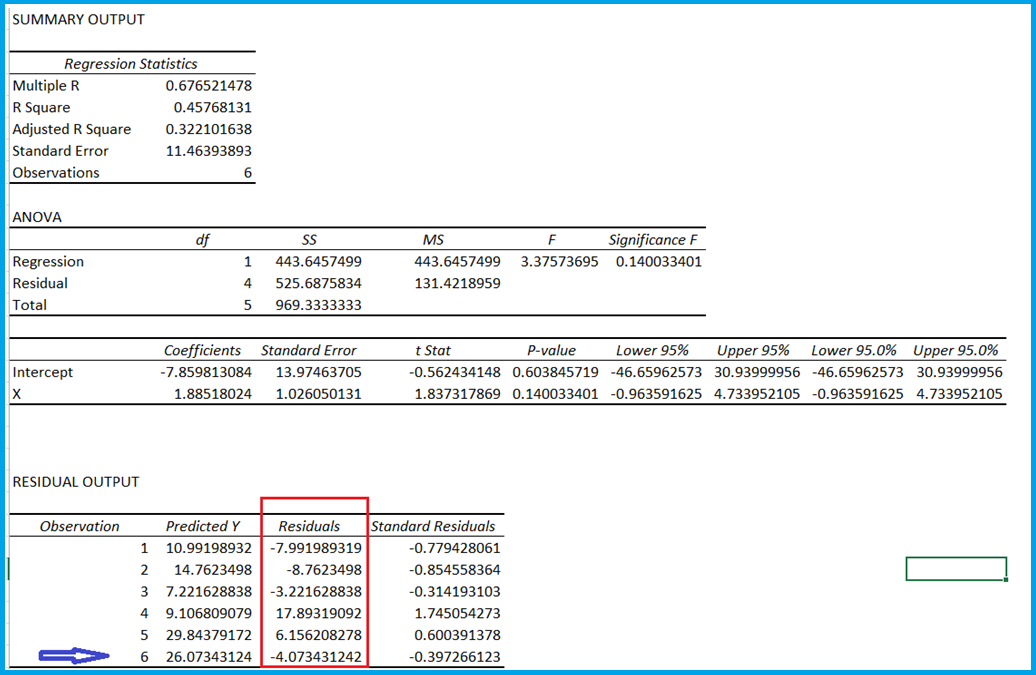
I have also highlighted what will be the residual value of Y when the value of X is 18.
Let me tell you that residuals play a very important role in Relative Value Trading (RVT).
You can download the Excel sheet from here.
Key points of this chapter
- Linear regression is a statistical operation that helps in creating straight line equations.
- Excel can be used to calculate linear regression. For this, an Excel plugin has to be installed.
- We get a lot of output from linear regression, which also includes slope and intercept.
- Using slope and intercept, we can find the value of Y.
- The difference between the actual value of Y and the predicted value is called residuals.
- You also get the value of residuals in the output summary.

Gaurav Heera is a leading stock market educator, offering the best stock market courses in Delhi. With expertise in trading, options, and technical analysis, he provides practical, hands-on training to help students master the markets. His real-world strategies and sessions make him the top choice for aspiring traders and investors.