In the previous chapter, we told that there are two techniques of pair trading. Now we will talk about the first technique, which is called correlation based technique. This is a very simple method of pair trading, many traders start pair trading on the basis of this technique.
Before we know about this technique, it is important that we know and understand some words related to it. So that it becomes easier to know this technique. All these words are related to tracking of pairs. So let’s start knowing these words
Spread – The word that is used a lot in the world of trading is spread. For example, if you are scalping in the market, then spread means the difference between the bid price and the ask price. If you are trading arbitrage, then spread means the difference in the price of the same underlying asset in two different markets. If you are into pair trading (mainly correlation based techniques) then spread means the difference in the closing price of 2 stocks.
To calculate the spread –
Spread = Change in closing value of stock 1 – Change in closing value of stock 2
Spread = Closing value of stock 1 – closing value of stock 2
Have a look at this
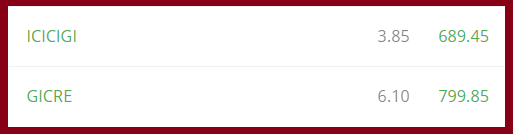
Suppose GICRE is stock 1 and ICICIGI is stock 2, the spread will be –
Spread = 6.1 – 3.85
= 2.25
Note that both 6.10 and 3.85 are the change in the stock from its previous closing price. Also, both the numbers are positive. But suppose ICICIGI’s closing price was negative 3.85, then the spread would be –
6.1 – (-3.85)
= 9.95
I have calculated the spread for the last few trading sessions to give you an idea of how the spread works. Also, I have calculated the daily spread which is commonly called the historical spread by traders.
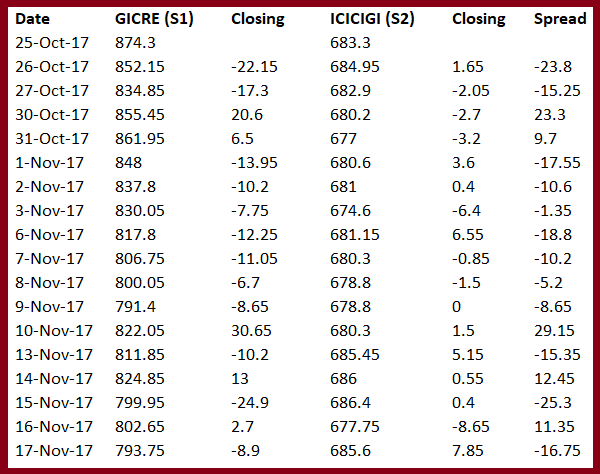
As you can see the spread keeps changing every day. Some of the main things that are visible are –
If the closing price of S1 is positive and the closing price of S 2 is negative then the spread increases
If the closing price of S1 is positive and the closing price of S 2 is also positive then the spread decreases
There can be many more such combinations due to which the spread can increase or decrease. But we will discuss that later.
Differential – In differential, the difference between the prices of both the stocks is measured. Differential tells the difference between the closing prices of both the stocks. The formula to calculate it is –
Differential = Closing price of Stock 1 – Closing price of Stock 2
So, if closing price of Stock 1 is 175 and closing price of Stock 2 is 232 then the difference will be –
175 – 232
= – 57
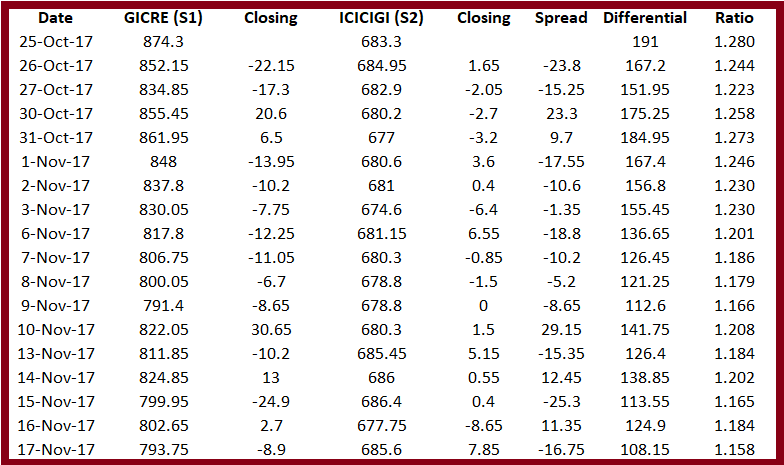
You can also look at the differential as a time series and calculate it every day. I have calculated it for GICRE and ICICIGI.

One important thing you should know about differential is that differential is not a good technique for tracking pairs on intraday basis, it should be used only at the end of the day i.e. at the last price of the day. If you want to track a pair on intraday basis, then you can use spread for that. We will discuss the correct use of differential for pair tracking later.
Ratio – I find ratio very interesting. To get it, the price of stock 1 is divided by the price of stock 2. Or the price of stock 2 can also be divided by the price of stock 1.
Ratio = Stock Price of stock 1 / Stock price of stock 2
Ratio = Stock Price of stock 1 / stock price of stock 2
I have calculated the ratio of both my stocks-
You can see that the ratio looks a bit more consistent when viewed as a time series. I have plotted all three variables in a graph below –
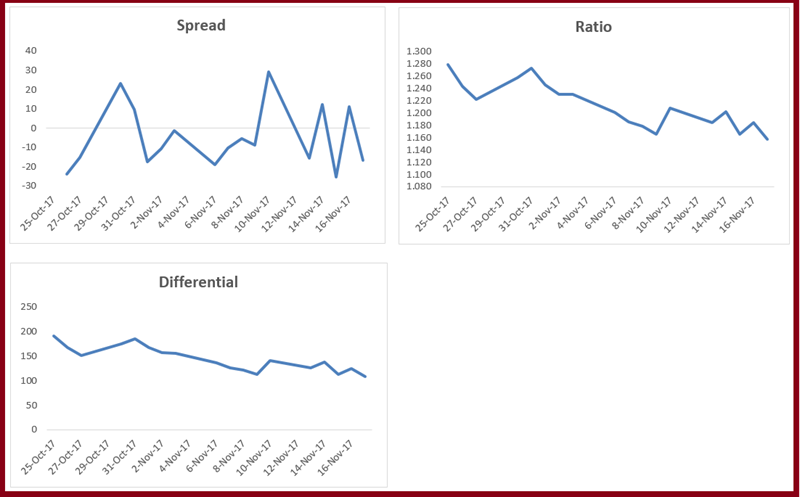
So how are the three things we discussed – spread, differential and ratio – related to pair trading?
These three different variables tell us the relationship between the two stocks that are considered as a pair. These three components are used to measure their relationship. This graph tells us how the two stocks move in relation to each other. For example, if we take the spread, we know that if the closing price of S1 is positive and the closing price of s2 is negative, then the spread decreases. Similarly, if the value of S1 is positive and that of s2 is also positive, then the spread increases.
Similarly, the ratio – the ratio between two stocks – decreases if the price of both stocks falls and increases if the price of both stocks rises. Apart from this, there can be many other variations, for example, if the price of stock 1 falls and the price of stock 2 remains flat or vice versa, then the ratio increases. Similarly, stock 2 can rise much more than stock 1 or vice versa.
All this can seem a bit confusing
That is why we have to look at the charts of all our components, whether it is spread, differential or ratio. We have to look at these components and find out whether the spread is increasing or decreasing. While doing this, two new terms will come up.
Divergence – If the spread or ratio between any two stocks starts to separate or the graph starts going up, then this situation is called divergence. If you are expecting divergence in your components, then you can try to make money by doing divergence trade.
Convergence – If the spread or ratio between two stocks starts coming closer or the graph starts going downwards, then it is called convergence. If you are expecting convergence in your components, then you can try to make money by trading convergence.
Now a big question – how will you believe that the components are going to converge or diverge? When will you prepare for the trade? How will you set up the trade? What if the trade does not go right? What will be the stop loss of such a trade?
Before answering these questions, some more questions – when do two stocks become a pair? Is the fact that two stocks belong to the same sector enough for them to be a pair? For example, can ICICI Bank and HDFC Bank become a pair just because they are both private sector banks?
To find out whether two stocks are becoming a pair or not, we can rely on a statistical measure, correlation. We have discussed this many times before, let us explain it again in brief –
Correlation tells us how two stocks move in relation to each other. Correlation is expressed as a number which is between – 1 to + 1. For example, if the correlation between two stocks is +0.75, then it tells us two things –
The + before the correlation number tells that there is a positive correlation between the two, meaning both move in the same direction
The correlation number tells us how strong the correlation is, the closer this number is to + 1 or – 1, the stronger the correlation will be considered, meaning both their movements will be largely similar
If the correlation number is 0, then it means that there is no correlation between the two stocks
So this means that a correlation of +0.75 means that both stocks will not only move in the same direction but will also move together to a large extent. But one thing to remember here is that correlation does not tell us how big the move will be. For example, if the correlation between stock A and B is +0.75 and stock A moves 3%, it does not mean that stock B will also move 3%. Here the correlation is only telling that stock B will also move upwards like stock A.
But there is another catch here, suppose the correlation between stock A and stock B is +0.75, the average daily return of stock A and stock B is 0.9% and 1.2%. So in such a case it can be said that if stock A has shown a move above its average daily return of 0.9%, then stock B will also show a move above its average daily return of 1.2%.
Similarly, a correlation of -0.75 means that both the stocks will move together but in different directions. For example, if the correlation between stocks A and B is -0.75 and stock A moves +2.5%, it means that the negative correlation will cause stock B to move down, but it is not known how much this decline will be.
One more thing about correlation, for those of you who are interested in mathematics, correlation data is useful only when the data series is ‘stationary around the mean’. This means that the closer the data appears to the average, the better.
Remember this principle of data series being ‘stationary around the mean’, we will come back to it when we discuss the second pair trading technique.
We will continue to use correlation to measure the relationship between two stocks. In the next chapter, we will learn how to calculate correlation in two different ways.
Hope you understand spread, differential, ratio, divergence trading, convergence trading and correlation.
Key points of this chapter
- The change in the closing price of the stocks of two companies is called spread.
- The differential tells the difference between the closing prices of two stocks.
- The price of stock 1 is divided by the price of stock 2 to get the ratio.
- When the spread or ratio between two stocks starts moving apart, it is called divergence.
- When the spread or ratio between two stocks starts coming closer, it is called convergence.
- Correlation tells us how strongly two stocks will move with each other.

Gaurav Heera is a leading stock market educator, offering the best stock market courses in Delhi. With expertise in trading, options, and technical analysis, he provides practical, hands-on training to help students master the markets. His real-world strategies and sessions make him the top choice for aspiring traders and investors.