Before understanding Super Trend it was important to know ATR because ATR is used in Super Trend indicator. The Super Trend indicator is also built on the price chart of a stock or index. The indicator line is red or green depending on the price. The super trend does not indicate the direction but after the direction is fixed, it helps to create the position and tells that the position should not be left till the end of the trend.
What do you need to know?
- Visually, the line of the Super Trend indicator is a continuous line, which changes color to green or red.
- In this indicator, when the price of the stock or index exceeds the value of the indicator, then it is a buy signal. At such times the color of the indicator turns green and you see that the price line crosses the indicator line (the price is higher than the value of the indicator).
- Once the trader has made a long position, he should not leave it until the price closes below the green line. So in a way, the green line acts as a trailing stoploss for the long position.
- A sell signal is generated when the price of the stock/index is less than the value of the indicator. At this point, the indicator is colored red and you can see the price and indicator lines intersecting (price less than indicator value)
- The sell signal can be used to create a new short or exit a long. But keep in mind that waiting for a sell signal to exit a long position can sometimes result in losses, so traders should use their experience here.
- Once a short position is taken, the trader should hold his position until the price closes below the green line. In a way, the red line acts as a trailing stoploss for short positions.
- Super trend refers to a trend so it is best used when there is a trend in the market.
- The Super Trend Indicator gives fewer false signals than any common moving average trading system. That’s why people prefer super trend instead of moving average trading system.
Using Super Trend:
When you select a super trend in the list of studies, you get to specify the period and the multiplier.
Here period means the number of days of ATR. Its default value is 7. This means it will calculate ATR for 7 days. You can change it according to you.
Multiplier means by which the number of the ATR is being multiplied. Its default value is 3 i.e. whatever is the value of ATR, it will be multiplied by 3. The multiplier is very important for super trend. If the multiplier is too high, then less signals are being produced. If the multiplier is too small, the number of signals increases, making you more likely to get a wrong signal. I recommend that you keep the multiplier 3 to 4.
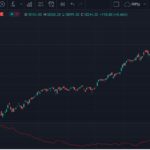
The chart of this indicator looks like this –

Notice how the color of the indicator changes with the change in price. Whenever a buy or sell signal is generated, green and red arrows are formed which tell the trader to go long or short.

Gaurav Heera is a leading stock market educator, offering the best stock market courses in Delhi. With expertise in trading, options, and technical analysis, he provides practical, hands-on training to help students master the markets. His real-world strategies and sessions make him the top choice for aspiring traders and investors.