If you look at a stock chart on a trader’s trading terminal, you will see a variety of lines on the chart. These are called ‘technical indicators’. The technical indicator helps a trader to analyze the movement in the price of a stock.
Technical Indicator is an independent trading system created by successful traders from around the world. The technical indicators are built on a preset logic, using which a trader can further strengthen his technical analysis (candlesticks, volume, S&R). Indicators help in making trading decisions such as buying, selling, confirming trades, and sometimes predicting trends.
There are two types of technical indicators leading and lagging. A leading indicator moves ahead of the price, which usually means that it usually signals a reversal in an already trend or the formation of a new trend. This sounds very interesting but here you should note that not all leading indicators are accurate. Leading indicators are notorious for giving false signals. Therefore, the trader should be extremely cautious while using the leading indicators. In fact, the efficiency of using leading indicators increases with trading experience.
Most leading indicators are called oscillators because they move around within a certain range. Usually, an oscillator stays between two values – for example between 0 and 100. Trading interpretations vary depending on the reading of the oscillator (eg 55, 70, etc.).
On the other hand, a lagging indicator follows the price; This means that it usually signals a trend reversal or after a new trend has occurred. You may wonder what would be the use of getting a signal after the event has happened? Well, it is better to get a hint later than not to get a hint. One of the most popular lagging indicators is the moving averages.
You must be wondering that if the moving average is an indicator in itself, why did we discuss it before discussing the indicators? The reason is that moving averages are a fundamental principle in themselves. Moving averages are used in many indicators like RSI, MACD, Stochastic. For this reason, we discussed moving averages as a separate topic.
Before we move on to understand different indicators, I think we should understand the meaning of momentum. Momentum is the rate at which the price changes. For example, if the stock price is Rs 100 today and it goes up to Rs 105 the next day, and to Rs 115 a day later, we say momentum is high because the stock price has changed 15% in just 3 days. However, if the same 15% change had happened in 3 months, we would have said that the momentum is low. So the faster the price changes, the higher the momentum.
Relative Strength Index
The Relative Strength Index or simply the RSI is a popular indicator developed by J.J. Wells Wilder has developed. The RSI is a leading indicator that helps identify a trend reversal. The RSI indicator ranges between 0 and 100, and based on the latest readings of this indicator, the direction of the market is predicted.
The term “relative strength index” can be a bit misleading as it does not compare two stocks, but instead reflects the internal strength of the stock. The RSI is the most popular leading indicator, providing the strongest signals during periods of range in sideways markets and in non-trend markets.
The formula to calculate RSI is:

Let us understand this indicator with the help of the following example: Suppose a stock is trading at 99, consider it as day 0, and now consider the following data:
| No. | Closing Price |
Points gain
|
Points loss
|
|---|---|---|---|
| 1 | 100 | 1 | 0 |
| 2 | 102 | 2 | 0 |
| 3 | 105 | 3 | 0 |
| 4 | 107 | 2 | 0 |
| 5 | 103 | 0 | 4 |
| 6 | 100 | 0 | 3 |
| 7 | 99 | 0 | 1 |
| 8 | 97 | 0 | 2 |
| 9 | 100 | 3 | 0 |
| 10 | 105 | 5 | 0 |
| 11 | 107 | 2 | 0 |
| 12 | 110 | 3 | 0 |
| 13 | 114 | 4 | 0 |
| 14 | 118 | 4 | 0 |
| Total | 29 | 10 |
In the above table, Gain/Loss in Points is showing Gain/Loss in Points from the previous day’s close. For example, if today’s close is 104 and yesterday’s close was 100, then the points will have an increase of 4 and a loss of 0 points. If today’s close was 104 and the previous day’s close was 107, then the gain would be 0 points and the loss would be 3 points. Please note that, defeat is calculated as a positive value.
We have used 14 data points for the calculation, which is the default setting in the charting software. This is also called the ‘look back period’. If you’re analyzing an hourly chart, the default period is 14 hours, and if you’re analyzing a daily chart, the default period is 14 days.
The first step is to calculate the ‘RS’ which is also known as the RSI factor. As you can see in the formula for RS, the ratio of average loss and average gain in points is called RS.
Average Gain in Points = 29/14
= 2.07
Average loss in points = 10/14
= 0.714
RS = 2.07 / 0.714
= 2.8991
Substituting RS in the formula for RSI,
= 100 – [100 / (1 + 2.8991)]
= 100 – [100 / 3.8991]
= 100 – 25.6469
RSI = 74.3531
As you can see the calculation of RSI is quite simple. The use of RSI helps the trader to identify overbought (overbought) and oversold (oversold) price zones. Overbought means that the positive buying momentum in the stock is so high that it may not be sustainable for long and hence there may be a correction. Similarly, an oversold position suggests that the negative momentum is high enough that a reversal is possible.
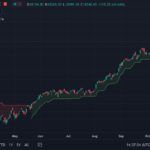
Take a look at the chart of Cipla Ltd. You will find a lot of interesting developments.

Firstly, the red line at the bottom of the price chart is showing the 14 periods RSI. If you pay attention to the scale of RSI, you will feel it’s upper bound to 100, and lower to 0. However, you will not see 100 and 0 in the chart.
When the RSI reading is between 30 and 0, the stock is oversold and should be ready for a correction. When the reading is between 70 and 100, the stock is heavily overbought i.e. overbought, and is ready for a downside correction.
The first vertical line marked on the left shows a level where the RSI is below 30, in fact, the RSI is 26.8. Means RSI is suggesting that the stock is oversold. In this example, the RSI price of 26.8 is consolidating with a bullish engulfing pattern. This gives the trader double confirmation of going long! Needless to say, Volume and S&R should also confirm this.
The second vertical line points to the level where the RSI turns to 81, where it is considered overbought. Hence, the trader should be careful in their buying decision of this stock if the intention is not to go short. If you look at the candles again, they will appear to be forming a bearish engulfing pattern. So the Bearish Engulfing pattern and the RSI of 81 together are giving a signal to the stock to go short. After this, the stock has a sharp and a short correction.
The example I have shown here is good enough, which means that both the candlestick pattern and the RSI are in perfect harmony to confirm the same event. This may not always happen. This leads us to another interesting way to interpret the RSI. Imagine the following two scenarios:
Scenario 1) The RSI of a stock that is in a continuous uptrend (remember that the uptrend can last from a few days to a few years) may remain stuck in the overbought zone for a long time because the RSI is at the upper end of 100 tied to. It cannot go beyond 100. So the trader would be looking for opportunities to short but on the other hand, the stock would be in a different zone. Example – Eicher Motors Limited stock has given a return of almost 100% year on year.
Scenario 2) The RSI of a stock that is in continuous decline will be stuck in the oversold zone as the RSI cannot go below 0. In this case, the trader will be on the lookout for buying opportunities but the stock is going down. Example – Suzlon Energy, this stock has given a negative return of 34% year on year.
This tells us that the RSI can be interpreted in many different ways, not just one classic interpretation.
If the RSI is in an overbought zone for a longer period, look for buying opportunities instead of shorting. RSI stays in the overbought zone for a long time due to a very positive momentum
If the RSI is in oversold territory for a longer period, look for opportunities to sell rather than buy. The RSI remains in the oversold zone for a longer period of time due to more negative momentum.
If the RSI starts moving away from the oversold area after a long period, look for buying opportunities at such opportunities. For example, the RSI moves above 30 after a long time, which could mean that the stock has bottomed out, and it is time to go long.
If the RSI starts to move away from the overbought zone after a long period of time, look for selling opportunities. For example, the RSI is moving below 70 after a long time. This means that the stock has formed a top, hence it is the right time for shorting.
One last note
None of the parameters used should be used with inertia when analyzing the RSI. For example, J. Wells Wilder chose to use a 14-day lookback period, as it gave the best results when analyzing market conditions in 1978 (when the RSI was introduced to the world). You can use 5, 10, 20 or 100 days duration if you want. In fact, this is how you develop yourself as a trader. You need to analyze what is working right for you and adopt the same. Please remember that the fewer days you use to calculate the RSI, the more volatile the indicator will be.
In addition, J. Wells Wilder decided to use 0-30 levels to indicate oversold areas and 70-100 levels to indicate overbought areas. Say again this is not a stone streak, you can arrive at your combination. I personally like to use the 0-20 level and the 80-100 level to identify oversold and overbought areas respectively. I use it with classical i.e. classic 14 day lookback period. Of course, I urge you to find the parameters that work for you. This is exactly what will eventually develop you into a successful trader.
Finally, remember that traders often don’t use the RSI alone, it is used in conjunction with other candlestick patterns and indicators to study the market.
Highlights of this chapter
- Indicators is an independent trading system developed by successful traders.
- Indicators are leading or lagging. Leading indicators indicate a possible event. On the other hand, lagging indicators confirm a trend.
- The RSI is a momentum oscillator that lies between the 0 and 100 levels.
- A RSI between 0 and 30 means that the stock is oversold, so traders should look for buying opportunities.
- An RSI between 70 and 100 is considered an overbought signal, so traders should look for sell opportunities.
- If the RSI price stays in one area for a long period of time, it shows a lot of momentum and there is less chance of a reversal, so the trader should consider trading in the direction of the momentum.

Gaurav Heera is a leading stock market educator, offering the best stock market courses in Delhi. With expertise in trading, options, and technical analysis, he provides practical, hands-on training to help students master the markets. His real-world strategies and sessions make him the top choice for aspiring traders and investors.