The Paper Umbrella is a single candlestick pattern that helps the trader to decide the direction of his trade. To understand the effect of the paper umbrella, it is necessary to see where it is being formed in the chart.

There are 2 types of trend reversal patterns in a paper umbrella, Hanging Man and Hammer. The hanging man pattern is bearish whereas the hammer pattern is bullish. The paper umbrella has a long shadow and a short upper body.
If the paper umbrella is at the lower end of the chart of a bearish rally, it is called a hammer.
If the paper umbrella is towards the upper end of the chart of a bullish rally, it is called a hanging man.
The specialty of a paper umbrella is that its lower shadow should be at least 2 times that of the real body. This is called the Shadow to Real Body Ratio.
Let’s look at an example. Open = 100, High = 103, Low = 94, Close = 102 (Bullish candle)
Here the length of the real body will be: close – open i.e. 102-100 = 2 and the length of the lower shadow will be open – low i.e. 100 –94 = 6. It is clear that the length of the lower shadow here is more than twice that of the real body, so we can assume that the paper umbrella has become here.
The Hammer Formation
The Bullish Hammer is a very important candlestick pattern that forms on the downside of a trend. The hammer consists of a short real body at the top of that day’s trading range and a long lower shadow. The longer the lower shadow is, the more bullish the pattern will be.
The chart below shows two hammers forming on a bearish day’s downside.

Note that the blue hammer has a very small upper shadow, which is valid because the second candlestick law tells us to “have some flexibility and check”.
The hammer can be of any color. It doesn’t matter what its color is, more importantly, whether it meets the “shadow to real body ratio” scale. By the way, a blue-colored hammer gives a trader too much confidence.
For a hammer, the trend before it should be down. Here the earlier trend is shown by a turning line below. Here’s the thinking behind Hammer:
The market is trending downwards and the market is occupied by the bears.
In this downward move, the market opens every day lower than the previous day’s closing price and then closes by making a new low.
On the day the hammer is formed, the market trades lower and makes a new low.
However, there is some buying at the lows due to which the prices move up a bit and the shares close at that day’s high.
The price movement on the day of the formation of the hammer suggests that the bulls are trying not to allow the price to fall further and have had some success.
This move by the bulls helps in improving the mood of the market and should be seen as a buying opportunity.
According to Hammer, deals should go something like this:
The formation of a hammer indicates the start of a purchase.
When a trader enters the market depends on how much risk he can take. If the trader is ready to take more risk then he can buy the stock on the same day. Remember that the actual body color doesn’t matter in the hammer, so there’s no violation of the first rule. If the trader wants to take a little less risk or wants to avoid the risk, he will see that the color of the candle is blue the day after the pattern is formed.
A trader willing to take the risk will check the open and close at 3:20 after the hammer is formed on the same day to confirm that the hammer has been formed.
Open and close should be almost equal (there should be a difference of only one or two percent)
The length of the lower shadow should be at least twice the length of the real body.
If both these conditions are met then it is a hammer and a trader willing to take the risk can initiate the trade.
The risk-averse trader will look at the OHLC data the next day and make a trade if the candle turns blue.
The low of the hammer acts as a stop loss for the trader.
The chart below shows a hammer in which both the risk-taker and the risk-averse trader will benefit in the trade. This is a 15-minute intraday chart of Cipla Ltd.

The deals will be like this:
The right price to buy for a risk-ready trader – he will buy only on the hammer candle i.e. at Rs 444.
Right buy price for the risk-averse trader – he will trade on the next candle after seeing that the next candle is blue in color.
The stop loss for both types of traders would be ₹441.50, i.e. low of the hammer.
You can see how the deals were completed and how they profited in intraday.
Now let’s look at another chart, here the risk averse trader takes advantage of the “buy strong and sell weak” rule

And now an interesting chart with two hammers.

Here both the hammers follow the conditions which are necessary to become a hammer.
The trend before this should be downwards.
shadow to real body ratio
In the first hammer, the risk-averse trader will protect himself from losses because he is following rule number 1 of candlesticks. But at the time of the second hammer, both risk-takers and risk-averse traders can get greedy and place their trades. Here the stock did not move up after the start of their trade, remained flat, and later broke down.
We know that you stay in a trade until the stoploss or your target is met. So, you don’t make any changes to your deal, so the deal (in the first hammer) is bound to be a loss. But remember this is a deliberate risk.
Now look at another chart where a hammer appears to be forming but it does not meet the bearish trend condition before the hammer. Therefore it cannot be defined as a hammer pattern.

The Hanging Man
If a paper umbrella is made at the top of a trend, then it is called a hanging man. The Bearish Hanging Man is a single candlestick pattern. It tells that now the direction of the market is about to change i.e. it shows trend reversal. The hanging man indicates that the market has reached its high. Hanging Man is called Hanging Man only when the market is moving bullish before it. A hanging man is formed aftermarket high, so bearish hanging man means selling pressure is coming

The hanging man’s candle can be of any color and if it is meeting its shadow to real body ratio, then the color does not matter. The trend prior to the formation of the Hanging Man should be an uptrend as shown by the turning line above. Let us understand the thinking behind its creation.
The market is bullish i.e. the market is in the possession of the bulls.
The market is making new highs and higher lows.
The day the Hanging Man pattern is formed, the bears have taken entry into the market.
A long lower shadow that forms with the Hanging Man indicates that the bears have arrived.
The entry of the bears into the market indicates that they are ready to snatch control from the bulls.
The hanging man pattern indicates that the time has come to short the market. Now let’s see how to make the deal.
The risk-taking trader can initiate his short trade on the same day near the closing price.
A risk-averse trader can start his trade on the next day when he sees that the candle is red in colour.
For both the risk taker and the averse trader, the way to correctly spot the candle is the same as in the hammer pattern.
Once a short trade is taken, the stoploss will be the high of the candle.

In the above chart, BPCL Ltd has created a hanging man at 593. OHLC is as follows:
Open =592, High = 593.7, Low =587, Close =593 The trade or deal is made on the basis of:
The risk-taker will place his short trade at 593 after the pattern is formed on the same day.
The risk averse trader will initiate his short trade on the next day at the closing price when he sees that the candle is red in colour.
Both risk averse and risk taker will place their trades.
The stoploss for these deals will be at the day’s high i.e. 593.75.
The deal will be beneficial for both types of traders.
My Experience with Paper Umbrella
Although both the hammer and the hanging are candlestick patterns, I rely on the hammer more than the hanging man. If all else being equal and there are two trade opportunities, one based on the hammer and one based on the hanging man, then I will put my money on the hammer trade. This is just a decision based on my experience. My faith in the hanging man wanes just because I don’t understand why if the bears have become so strong, why did the price go up after the market formed a low? According to me, this happening indicates that the bulls are still strong in the market.
I would request you to look at the market for yourself and make up your own point of view. With this, you will be able to make your new policies regarding the market and understand the market better.
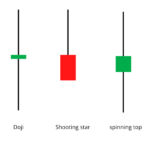
The Shooting Star
In the single candlestick pattern, the shooting star is the last pattern that we will understand. Next, we will try to understand the multiple candlestick patterns. Price action is very powerful or important in Shooting Star. That’s why the shooting star pattern is a very popular pattern.
Visually, the shooting star looks like an inverted paper umbrella.

The Shooting Star differs from the Paper Umbrella in one respect that it does not have a long lower shadow, but the Shooting Star has a long upper shadow. Even here, the length of the shadow is at least twice that of the real body. Here also the color of the candle does not make any difference, but if the candle is of red color then it is definitely considered more reliable. In this, the larger the upper wick, the more it is considered to be a bearish pattern. The real body is much smaller in both Shooting Star and Paper Umbrella. By the book’s definition, a shooting star should not have a lower shadow, but a smaller lower shadow as seen in the chart above is sometimes valid. Shooting Star is a Bearish pattern so the trend before it should be Bullish.
The thinking behind Shooting Star:
The stocks are bullish, which means that the market is completely controlled by the bulls. When the bulls are strong, the stock or market keeps making new highs and higher lows.
The market makes a new high on the day the shooting star pattern is formed.
Selling or selling pressure increases in the market at the day’s high or high, due to which the stock price closes at that day’s low, and a shooting star is formed.
A sell-off in the market suggests that the bears have entered the market and have now been somewhat successful in bringing the price down, a long upper shadow suggests the same.
It is expected that the bears will continue to sell in the market and this trend of selling will continue for the next few days. Therefore traders should look for opportunities to short.
Take a look at this chart which has a shooting star on the top of the bullish chart.

This Shooting Star has OHLC:
Open = 1426, High = 1453, Low = 1410, Close = 1417
Based on this, this deal will be made.
The risk-taker will start his deal on 1417 i.e. on the same day as the shooting star.
When the risk-taking trader starts his trade, he will see that the shooting star has really become. He will check it too.
CMP or current market price is approximately equal to the low price.
The upper shadow is at least twice the length of the real body.
A risk-averse trader will place a trade on the next day when he sees that a red candle has formed on the next day.
Once the trade is opened, the stoploss will be placed at the day’s high. Like in this trade at 1453.
As we mentioned earlier, once the trade is opened, we have to wait till either the stoploss or the target is reached. Yes you can trail your stoploss, although we haven’t talked about trailing yet and we will discuss that later.
In the chart below, both the risk taker and the risk avoider made significant profits in the deals on the basis of Shooting Star.

This is an example where both risk taker and avoidant traders have placed their trade based on shooting star but in this case the stoploss is broken. You have to get out of it because that deal is no longer useful. It is usually best to walk out of this type of deal.

Highlights of this chapter
- A paper umbrella has a long lower shadow and a smaller real body. The lower shadow and real body should have a shadow to real body ratio. The lower shadow in the paper umbrella should be at least 2 times that of the real body.
- Because the open and close are very close to each other, the color of the candle in the paper umbrella does not make any difference.
- If the paper umbrella is formed at the bottom of a bearish chart, then it is called a hammer.
- If the paper umbrella is formed upwards in a bullish chart, then it is called hanging man.
- The hammer is a bullish pattern and once it is formed, you should look for buying opportunities.
- Hammer’s low is your stoploss.
- A hanging man is a bearish pattern that occurs on the upside of the chart and you should look for selling opportunities.
- Hanging man’s high will be your stoploss.
- Shooting Star is a bearish pattern which is on the up side of the chart and you should look for opportunities to short while Shooting Star.
- Shooting Star’s High will be your stoploss

Gaurav Heera is a leading stock market educator, offering the best stock market courses in Delhi. With expertise in trading, options, and technical analysis, he provides practical, hands-on training to help students master the markets. His real-world strategies and sessions make him the top choice for aspiring traders and investors.


