The Spinning Top
The Spinning Top is a very interesting candlestick pattern. Like the Marubozu, it does not give the trader the right signals to enter and exit the market, but the spinning top gives very important information about the current condition of the market, Based on this information, it becomes easy for a trader to make his position in the market.
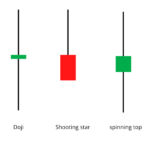
Take a look at the spinning top candle shown below and tell us what is special about it?

you will see that
- The real body in these candles is very small.
- You’ll also notice that the Upper and Lower Shadows almost are equal.
What do you think happened in the market during the day that the spinning top candle was formed? In appearance, the Spinning Top looks like a very simple, small real-bodied candle, but in reality, many of the events of the day are hidden in it.
Let’s look at these events:
Small Real Body – This indicates that the open price and the close price are very close to each other. For example, the open price may be ₹210 and the close price may be ₹213 or the open price may be ₹210 and the close price may be ₹207. In both these situations, it is common to become a small real body because a change of ₹ 3 doesn’t make much sense for a ₹200 stock. Because the open price and the close price are so close to each other, the color of the candle doesn’t mean much. It does not matter whether the candle is blue or red, it means that the open price and the close price are very close to each other.
Upper Shadow – The upper shadow connects the real body to the highest level of the day. If it is a red candle, the high and the open are aligned, and if it is a blue candle, the high and the close are aligned. If you forget the lower shadow for a while and focus only on the smaller real body and the upper shadow, then what do you understand, what would have happened in the market? The presence of the upper shadow indicates that the bulls in the market tried to move the market up but they did not succeed in this effort. if they had been successful in this endeavor, the real candle would have been a long blue candle, not a short candle. It means that the Bulls tried but did not succeed in their attempt.
Lower Shadow – Lower shadow connects the real body to the low point of the day i.e. the lowest price. If it is a red candle, then the low and close join together, and if it is a blue candle, the low and the open join together. If you look at the real body and the lower shadow together and ignore the upper shadow, what do you see, what would have happened? Just as it happened with the bulls, the presence of lower shadows suggests that the bearers tried to take control of the market and pull the market down but they did not succeed in their attempt. If the bears were successful in their attempt, then the real body would have been long and red in color and there would not have been a small candle, so it would be considered as an attempt by the bearers.
Now guess about all the parts of the spinning top – real body, upper shadow, and lower shadow – all together. Bulls made an attempt to move the market up which did not succeed, the bears tried to take the market down which did not succeed. Both bullish players and bearish players i.e. Bulls and Bears tried to take possession of the market, but their efforts were not successful. This is what a small real body shows. That’s why spinning top means that there is uncertainty in the market right now and no one direction is being decided in the market.
If you just look at the spinning top, it doesn’t tell you much, it just tells that both the bulls and the bears could not capture the market. But when you see the spinning top on a chart it will tell you very strongly what is happening in the market and based on that you will be able to make your position in the market.
Meaning of Spinning Top in Bearish
What if a spinning top candle is formed when the stock is going bearish? When bearish is going on, the market is dominated by the bears. The bears may be preparing for a fresh round of selling at the time of the formation of a spinning top. While the bulls are trying to make their positions to stop the fall in the market, but their efforts are not being successful. If the bulls’ attempt was successful, it would have been a day with a blue candle and not a spinning top. In such a situation, what will you decide considering the spinning top? You have to see what is going to happen next while deciding. Two things can happen next:
Either there will be more selling in the market
Or will the market recover and move upwards?
When the picture is not clear, the trader should prepare for both positions i.e. both going down and going up.
If the trader is looking for a bullish opportunity in the market, then this might be the right opportunity for him, but he needs to be a little careful. Therefore, in such a situation, he should invest only half of his total capital at this time. Meaning if his intention was to buy 500 shares then he should buy only 250 shares at this point of time and wait. It should be seen that what is the trend of the market and where does the market go? If the market goes up, he can also buy the remaining 250 shares and average the price. If the market really starts going up, the trader will have got the shares at the lowest price.
But suppose the reverse happens and the share prices start falling further, the trader will still lose half because he has bought half the shares, not all.
Here’s a chart below showing what happens when a spinning top is formed during a bearish period. In this example, the stock picked up after the spinning top.

Now let’s see another chart, in this chart, there is a bearish phase after the spinning top.

It can be said that Spinning Top is the calm before the storm. This storm can accelerate or slow anyone. This storm can also bring a change in the trend. It is not known where the market will go, but it definitely shows that the market is going to get direction and you have to be ready for it.
Meaning of spinning top in bullish
The effect of a spinning top during a bullish period is similar to that of a bearish period. We just look at it a little differently. Take a look at the chart below and let me know what you think.

It is very clearly visible here that the market is bullish, which means that the market is completely controlled by the bulls. But since the creation of Spinning Top, there has been a bit of confusion.
The hold of the bulls has become weak, otherwise, the spinning top would not have been formed.
Spinning top means that bears have entered the market. Although they have not been successful yet, the bulls have given them a place to enter.
what will you do now? What is the meaning of this situation? What position do you think you should take?
The Spinning Top indicates that there is confusion in the market and neither the Bulls nor the Bears are able to fully control the market.
Looking at this bullish timing environment, we know two things
The bulls are holding their positions and are preparing for the start of a new uptrend.
The bulls are tired and now they can give a chance to the bears to enter the market which means a correction is coming in the market.
The probability of both of these in the market is 50-50% i.e. half-half.
What will you do now if the possibilities are equal on both sides, what will be your next step? In fact, you should prepare for both sides.
Suppose you bought shares before the start of the stock market rally, this is your chance to book some profit. But in such a situation, you should not book your entire profit, suppose you have 500 shares, you can sell 50% of it i.e. 250 shares. Two things can happen after you do this:
Come into the bearish market – If the market becomes bearish and the bears enter the market, if this happens then the market will start going down. You have taken advantage by selling 50% of the shares, now you can withdraw the profit you are getting from the 50%.
Get into the bulls market – if the market bounces back i.e. if the bulls were slacking off and preparing for a new rally, you still haven’t exited the market completely, you still have 50% capital remaining and you can earn more profit in coming time.
Such a decision can bring you benefits on both sides.
Following the uptrend in the chart below, a spinning top has been formed and after that, the market has gained further momentum. In such a situation, if 50% of your equity investment is still in the market, then you can take advantage of this rally.

Overall, the Spinning Top candle indicates uncertainty in the market. This shows that there are equal chances on both sides that the market can go up or down. Until the situation is clear, the trader should be a little careful and keep his positions to a minimum.
The Dojis
Doji is also a single candle pattern. This too is almost like spinning tops, but they don’t have any real body at all. Not having a real body means that here the open and close prices are equal. The Doji informs us about the mood and environment of the market and in that sense it is an important pattern.

The definition of Doji is that the open price and the close price are equal and there is no real body at all. However, big can the upper and lower shadows be.
However, we can sometimes consider a pattern with a thin candle as Doji, keeping in mind the second rule of candlesticks – we should be a little flexible in our thinking and examine the pattern or chart. There is no need to always look for doji with no real body.
In this case, the color of the candle doesn’t matter, the only thing that matters is that the open and close prices are equal.
The effect of Doji is also similar to that of Spinning Top. Everything we have learned about spinning tops applies to doji as well. In fact, Doji and spinning top often appear together, in the same group, at one place and indicate the confusion of the market.
Taking a look at the chart below, you will see how the Doji is formed in a bearish market and tells the confusion before the next move of the market.

Now look at this chart, here the Doji formed after a nice uptrend, and then the market changed its direction and came down.

So now if you look at a Doji or Spinning Top separately or together, remember that the market is unidirectional i.e. confused. In this case, the market can go either way and you should place your trades in such a way that you can get the benefit of both sides.
Highlights of this chapter
- The spinning top has a very small real body, plus, the upper and lower shadows are almost equal.
- The color of the candle does not matter in a spinning top. What matters is the fact that the open and close prices are very close to each other.
- Spinning top refers to the confusion of the market. Bulls and Bears are on par, the market is looking for a new direction.
- The formation of a spinning top in a rally means that either the bulls are slowing down and preparing to take the market up again, or the bears are preparing to enter the market and the uptrend is about to stop. In any case, the trader should be cautious, buy only half of his total purchases and watch the direction of the market.
- A spinning top that forms at the bottom of a rally means the bears are either tired or sluggish. If they are tired then the bulls will enter the market and the trend will change and the market will go up. In both situations, the trader should be careful and make only half of his trade.
- Dojis are also like spinning tops. They also show that the market is directionless. By definition, the real body in Doji is negligible. But a candle with a very thin body can also be considered a doji.
- A trader’s strategy is the same in Doji and Spinning Top.

Gaurav Heera is a leading stock market educator, offering the best stock market courses in Delhi. With expertise in trading, options, and technical analysis, he provides practical, hands-on training to help students master the markets. His real-world strategies and sessions make him the top choice for aspiring traders and investors.


