History repeats itself – the biggest Assumption
As we have talked about earlier, the most important concept in technical analysis is that history repeats itself. Technical analysis uses this concept over and over again. This is the most important concept.
It is important to understand this concept of technical analysis more deeply as candlestick patterns completely form the basis of this concept.
Suppose today is 7th July 2014 and some things are happening in the market.
Event A – The stock has been falling continuously for the last 4 days.
Event Two – Today is the 5th trading session on 7th July 2014 where the shares are falling. Share volume is also low.
Event 3 – The range of the share price is also much smaller than the previous days.
Keeping these events in mind, now you assume that on the next day i.e. on 8th July 2014, the decline of the shares stops and the shares also close with a slight increase. So the stock market went up on the sixth day as a result of the last three events.
Some time passes let’s say a few months, and for 5 days in the market again events as we saw above. Now, what do you expect for the sixth day?
We believe that history repeats itself. Here we add one more thing to our concept, that is, when the events of the last few days are going on like any other time in history, then we can assume that the result which was shown after those events is the same result again. will be seen from On the basis of this estimate, we say that now the stock will go up on the sixth day.
Candlestick Patterns and Expectations
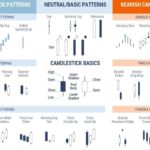
Candlestick is used to understand trading patterns. Pattern, that is, when a particular kind of event gives indications of a particular way, then it is called pattern. Technical analysts decide their trade based on the pattern. In any pattern, two or more candles are attached in a particular way. But sometimes a pattern can be understood from a candlestick as well. Therefore candlestick patterns can be divided into single candlestick patterns with one candlestick and multiple candlestick patterns with multiple candlesticks. The most common single candlestick pattern names are:
Marubozu
Bullish Marubozu
Bearish Marubozu
Doji
Spinning Tops
Paper umbrella
Hammer
Hanging man
Shooting Star
A multiple candlestick pattern is one in which several candlesticks form a pattern. The things we will learn about in multiple candlestick patterns are:
Engulfing pattern
Bullish Engulfing
Bearish Engulfing
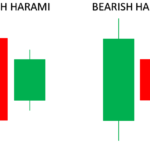
Harami
Bullish Harami
Bearish Harami
Piercing Pattern
Dark cloud cover
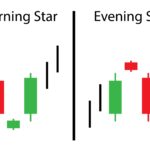
Morning Star
Evening Star
You must be wondering what do these names mean? As we mentioned earlier, many of these names still come from the Japanese language.
Candlestick patterns help a trader to strategize a trade and create an outlook. Each pattern has a risk strategy, as well as entry and stop-loss price signals.
Some special beliefs related to candlesticks
Before we start knowing and understanding about the patterns, it is important to keep some more concepts/assumptions in our mind. These concepts are linked to candlesticks. Keep these concepts in your mind properly because we will come back to them again and again in the times to come. You may not understand these concepts completely yet, but going forward we will understand about them in more detail. Therefore, it is necessary to know a little bit from them from now on.
Buy in strength and sell in weakness – Blue colored candle i.e. Bullish candle shows strength and Red colored candle is bearish i.e. shows weakness. So whenever you are buying, see if that day is a blue candle and when you are selling it should be a red candle day.
Leave room for change in every pattern – Don’t blindly follow any pattern. A pattern may be meeting one definition, but there is always room for slight variations as the market changes. So it is important that you be ready to change a little within a limited range and be ready to change the pattern a little bit accordingly.
Look at the previous trend of any pattern – If you are seeing a bullish pattern, then check the previous trend because it should be bearish and if you are seeing the bearish pattern then the pattern before it is bullish Should be.
Highlights of this chapter
- History repeats itself, this concept has been modified slightly.
- There are 2 types of candlestick patterns single pattern and multiple candle pattern.
- Candlestick patterns have their own concepts of 3 ways.
- buy strong and sell weak
- test the pattern, and
- Check out the old trend

Gaurav Heera is a leading stock market educator, offering the best stock market courses in Delhi. With expertise in trading, options, and technical analysis, he provides practical, hands-on training to help students master the markets. His real-world strategies and sessions make him the top choice for aspiring traders and investors.