Brief Description
In the previous chapter, we have understood the definition of technical analysis. In this chapter, we will learn its concepts and some of its utilities.
Use of different assets
The most important utility of technical analysis is that it can be used in any type of asset class. The only condition is that old historical data for that asset class is available. Historical data means open, high, low, close (OHLC), and volume data is available for that asset.
Let us try to understand it with an example. Once you learn to drive a car, you can drive any type of car. Similarly, once you have learned technical analysis, you can use it in share trading, commodity trading, forex trading, fixed income products, anywhere.
This is the biggest advantage of technical analysis over any other method of technology. For example, in fundamental analysis, you have to look at all the things like loss, profit, balance sheet, cash flow of each stock, whereas in commodity analysis, many of these things are not useful. You have to use a new method of data.
If you want to do a fundamental analysis of agricultural commodity like coffee or pepper, then you have to collect information about various things like a monsoon, yield, demand, supply, stock. Similarly, if you want to do fundamental analysis about metal or an energy-related commodity like crude oil, then you will need different types of data.
But the technical analysis of each asset class can only be done in the same way. For example, the moving average convergence divergence (MACD-moving average convergence divergence) or the relative strength index (RSI-Relative Strength Index) can be used for any asset class such as equity, commodity, or currency.
Concepts of Technical Analysis
Technical analysis does not take into account whether a stock is undervalued i.e. cheaper than its actual value or overvalued i.e. costlier than its actual value. Only one thing is important in technical analysis – and that is the old trading data of the stock and what this data can indicate about the future.
Technical analysis is based on some basic concepts that you need to know about:
The market includes everything necessary in the price (Markets discount everything) – This concept tells us that every information related to stock is included in the market price of that share. For example, if a person is quietly buying a stock from the market because perhaps he knows that the company’s next-quarter results are going to be good, then the stock will make a profit. Even if that person is doing this covertly, but its effect starts showing in the share prices. A good Technical Analyst identifies this on the chart of the stock and considers this stock suitable to buy.
“What” is more important than “why” – this concept is derived from the very first concept. As in our previous example, a good technical analyst wouldn’t want to know why the person bought this stock. The technical analyst’s full focus will be on how that person’s hidden purchase is affecting the share prices and what will happen next?
Price moves in trend – According to technical analysis, every change in price indicates a specific trend. For example – Nifty rising from 6400 to 7700 – did not happen in a day. This trend started 11 months ago. Another concept related to this is that when the move starts on one side, then the price of the stock also moves in the same direction, sometimes upwards and sometimes downwards.
History repeats itself – According to technical analysis, the price movement repeats itself. This is because market participants react in the same way each time to the same event. That’s why the share price moves in the same way. For example, in an uptrend market, every player in the market wants to buy shares at any price, no matter how expensive that stock may be. Similarly, in a falling market, he wants to sell at any price even if the share price is much cheaper than its actual price. Because of this habit of man, history repeats itself.
The Trade Summary
Indian stock markets are open from 9:15 am to 3:30 am. Lakhs of trades take place in these 6.15 hours. Every minute some deal is happening in any one stock. The question that arises is, as a market participant, should we keep an eye on every transaction?
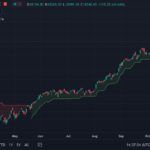
To take a deeper look at this, let’s talk about an imaginary stock. Look at the picture below, each point represents a trade. If we show every transaction that happens every second on this graph, then nothing will be visible in this graph. Therefore, only a few important points are being shown here.
Daily Trade Pattern

The market opened at 9:15 in the morning and closed at 3:30 in the evening. To understand the trend of the market, instead of looking at all the trades that took place during this period, it will be enough to see a brief description of them.
If we look at the open ie opening price, high i.e. highest price, low i.e. lowest price and close i.e. final price in the market, then we will get a rough summary of the market.
Open Price: Open price is the price of the first trade or deal to take place at the time the market opens.
Highest Price: The highest price on the day at which a trade is made.
Lowest Price: The lowest price of the day at which the deal was done.
Price at the time of close i.e. Close: The price in the last trade of the day. This price is considered very important as it shows how strong the stock was during the day. If the closing price is above the opening price then it is considered a bullish day. Similarly, if the closing price is below the opening time price, then it is considered a bearish day.
The close or closing price is also seen as a signal for the next day and it determines the mood of the market. That is why C means close in OHLC (Open High Low Close).
All four of these prices are seen in technical analysis. These are analyzed by putting them on a chart.
Highlights of this chapter
There is no restriction in technical analysis, it can be used in any asset class.
There are certain concepts in TA.
All information is included in the market price.
“What” is more important than “Why”
Price follows a trend.
History repeats itself.
OHLC is a good way to summarize day trading.

Gaurav Heera is a leading stock market educator, offering the best stock market courses in Delhi. With expertise in trading, options, and technical analysis, he provides practical, hands-on training to help students master the markets. His real-world strategies and sessions make him the top choice for aspiring traders and investors.